""

Xcelsius in BI on Demand (BIOD)

In this blog article I am going to talk about Xcelsius in SAP BI On Demand (BIOD). What I am going to explain are the steps that you should follow to upload an existing Xcelsius Dashboard to the BIOD system. 

What is BIOD?

First of all, for those who don’t know what is BIOD I will give a brief explanation. Basically we can say that BIOD is the most complete and approachable cloud based business intelligence suite available in the market today. BIOD is software as a service; you do not need to install any software on your machines to get instant value from the system. All you need to do is Log in and provide some data. It is a cheap BI solution, due to the fact that you don’t need to make a huge investment in hardware, licenses, etc... everything is in the net.  The target for this technology is small companies, which are less likely to be able to acquire a BI system due to the costs, but with BIOD they have an accesible  way into SAP BusinessObjects analysis system. In BIOD you are able to create:

  • Xcelisus Dashboards
  • Web Intelligente reports
  • Explorer

You can get more information about BI On Demand here.

 Now, let´s see how to upload an existing XCelsius Dashboard to the BIOD system.

How to upload an Xcelsius Dashboard to BIOD?

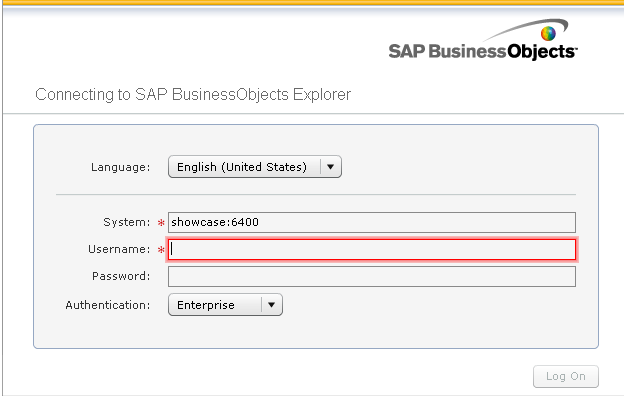
First of all, if you don’t have a BIOD account you should create it. It s free, and with it you will able to test most of the features of this cloud system. Click here to Sign up.

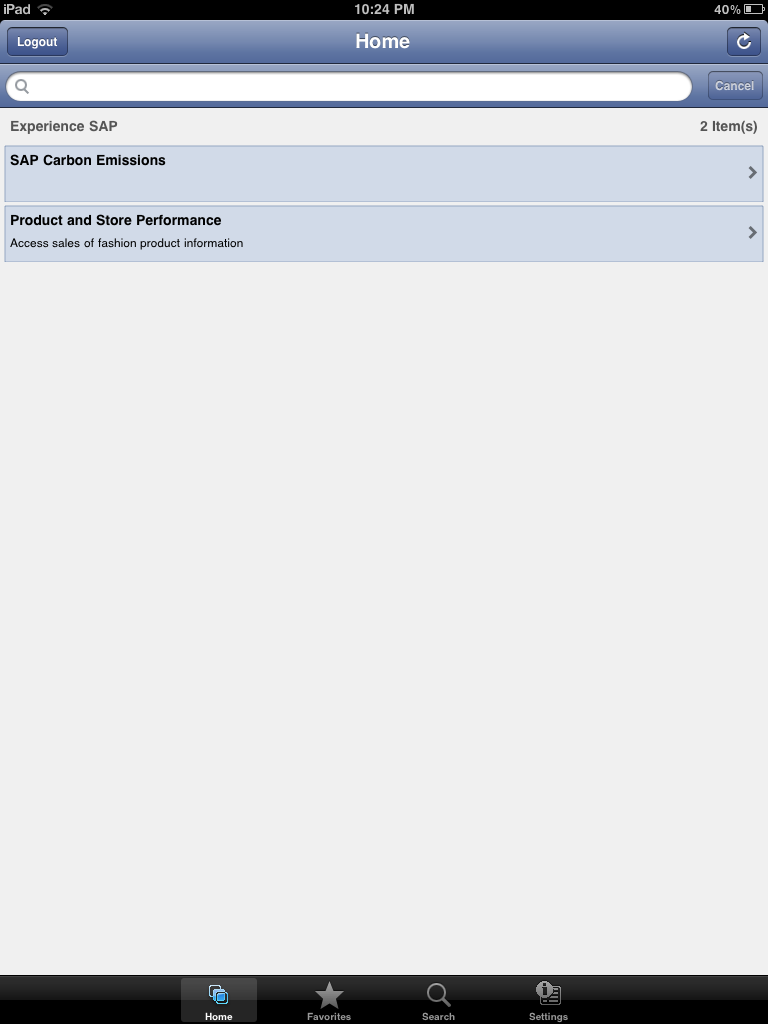
Once we are logged, we will see this screen.

Now I want to show you how you should upload an existing Xcelsius file with static data to the BIOD system.

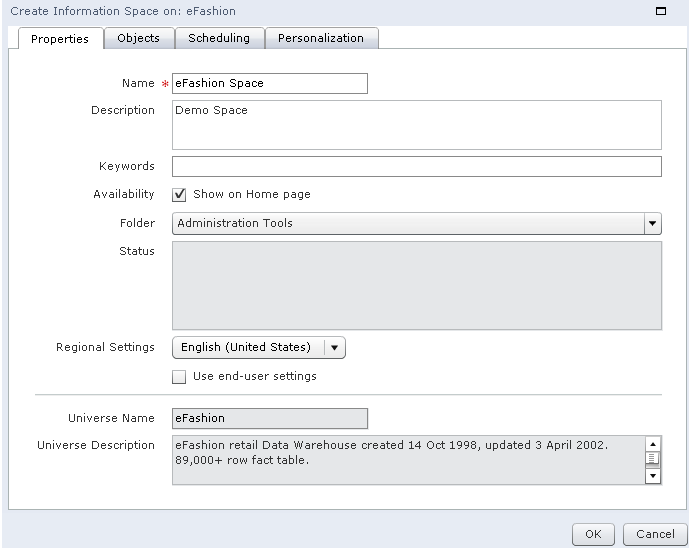
First of all we should create the DataSource, so in my Stuff panel we should select Datasets. After that we click Add New Button  -> Add Dataset

Then we should chose from which place we will select the dataset. We have several options: Create From Query (this option is only available in the BIOD Advanced version, where the connection to a universe is possible), bring data from salesforce or create an empty dataset from scratch and finally, we can upload a file (xls,xlsx or csv) which we will use in this example.

As I said before, we select an excel file as source of our dataset, in the first row of our excel file it is important to have the labels of each column. We can also edit this dataset, change the value type of each column, the label name, etc...

At the bottom of this page we can find the properties section, here we should enable the Web service. Once we have done this, the system will generate a url that will be the reference to the dataset in our dashboard.

The next step will be to upload the Xcelsius file as a template, so we select Add New -> Add Template.

We create a name for this template, uncheck the Create a new Xcelsius file check box and finally, select the xlf file that we have locally.

The screen below will then appear. In order to connect the dataset to our xlf file we should select the blue sentence (you may click here to edit the Xcelsius file). You can also attach an image of the dashboard as a thumbail for repository. The object selection will be fancier.

Once the Xcelsius editor is opened we add a connection using OnDemand -> Add Connection menu option. This will create one Flash Variables connection ([Flashvar]) and two Web Service Connections ([OD_Data1 and OD_Data2). In our case we should delete one data connection because we only have one source, but in case we need more data sources we can create as many as we want. It will also create a new tab in the XC spreadsheet that contains these cell bindings.

After that we configure the data connections. Open the Data Manager (Data -> Connections) and you will see a Connection of type FlashVars.  You should see the following:

  • get_data_url: (mandatory). This should be bound to the cell which the Web Service Url of the Web Service Connections are also bound to. If you have multiple connections this should be bound to the range which holds those connections.

Then each Web Service Connection (OD_DataN), in our case only OD_Data1 points to the set of cells to which that connection outputs its data.

These are the next steps that you should follow in order to setup the dashboard:

  • Click on My Datasets and click copy beside the dataset OD_Data1.
  • Paste the url from dataset to the WSDL URL input box of a Web Service connection

  • Click Import to import the schema.
  • Bind the web service url to the same cell as get data url (Note: if you used the Add Connection process this should already be done).
  • Bind the headers and the row values.
  • Set Refresh on Load to be true.

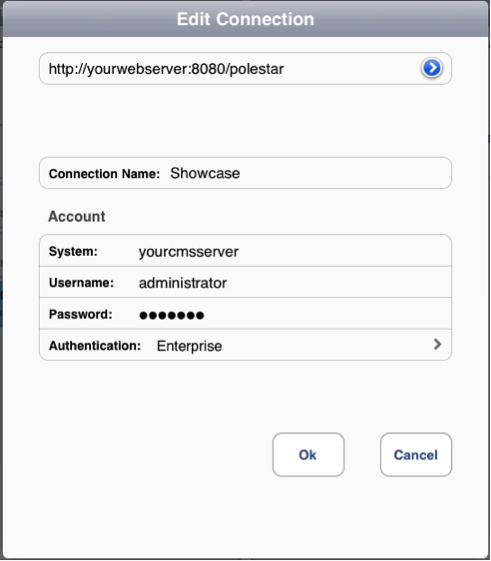
After these steps you can save your changes and then click the Back button to go back to Edit Connection step of creating a template. You should see your connection listed on the screen.

Click Next to go to the Edit Sample Data step, you can choose to add in your sample data from the XLF if you like, and then click Finish.

Finally we will create a visualization using this template. We select our Data Input, in this case Data Source.


If we go to the visualization menu we can find the object.


In conclusion we can say that the BIOD system is a nice tool to start testing the power of the SAP solutions without a potential heavy investment at the beginning. It can be also a good tool to make demos on and show our dashboards to customers. It is very interesting to test the explorer tool, you can see the amount of options that the BIOD brings you in terms of data analysis.  If you are interested in the advanced solution you should get in touch with SAP.

If you have any comment or doubts do not hesitate to contact us or leave a comment below.

Tackling the Aggregate Awareness Dilemma

In my last project I faced a situation where the customer asked me about the best option for a particular topic and this time my answer had to be "it depends". As a consultant, my duty was to provide two different options (with their corresponding pros and cons) but I could not make a decision on this, since the answer was highly dependent on the composition of IT service providers in different areas and also their road map. In general BI terms, we could define aggregation as the process of summarizing information at a certain level of detail in order to improve the performance. The Kimball Group defines Aggregate Navigation as the ability to use the right aggregated information and recommends to design an architecture with services that hide this complexity from the end user. In the BusinessObjects world the same concept is called Aggregate Awareness and the database administrators community usually refers to it as query re-write.

In SAP BusinessObjects, this can be achieved through the use of the function @aggregate_aware, contexts and incompatible objects in universe designer. At a database level (RDBMS), certain vendors provide this feature through Materialized Views with query re-write option (Oracle, Sybase, DB2, Informix, PostgreSQL and some others).

So here we have the dilemma: where to place this logic in a customer environment: in the physical layer or in the logical layer?

Both options are valid, but there are some considerations that need to be taken into account from different points of view:

Table Comparison

The information seen in the table above can already be interpreted, but as a summary, my recommendation would be:

Implementing Aggregate Awareness in SAP Business Objects:

  • Ideal for an architecture with many database sources (not all database sources support the query re-write feature and it needs to be maintained in each of them)
  • Good to have if the database vendor may be changed in the future (no changes needed in the universe)
  • No access to strong Database Administrators that can properly tune the database
  • Closed reporting architecture relying on a strong semantic layer in Business Objects
  • There is a need for a centralized metadata repository

Implementing query re-write mechanisms in the RDBMS:

  • Ideal for an architecture with many reporting tools accessing the same database
  • Access to strong Database Administrators
  • It simplifies universe design
  • There is no need for a centralized data repository

If after reading this post you still have doubts on what direction to go for at your company or customer, do not hesitate to contact clariba at info@clariba.com or leave a comment below.

SAP BusinessObjects Explorer 3.2: Creating Row-Level Security

In the past few months I had the chance to implement a solution based on the combination of SAP BusinessObjects Explorer and mobile devices. The challenge was: “I want to explore the same information that I see on my dashboards with SAP BusinessObjects Explorer on my iPad. In this particular case, some of the customer`s dashboards were really complex and we had to deal with many issues. Today I would like to share with you how we solved one of these issues:

How to implement row-level security into a space of Explorer?

The solution to this challenge cannot be based in any case of security implemented at universe level, in SAP BO Explorer the information of the spaces is retrieved when we index the space, this means that any kind of security applied at universe level will have a direct impact when we index the space. What we needed was a space with all the information but able to be filtered on demand based in some personalization rules.

With SAP BO Explorer 3.2 we are able to generate and apply this kind of security by creating two spaces: one reference space with all the possible information to explore and one personalized, where we will be able to filter the information displayed on demand based on the rules of personalization and making use of the reference space.

Definition of the scenario

To be able to follow the implementation of the solution, assume that we start from:

  • SAP BusinessObjects XI 3.1 installed and fully operational
  • SAP BusinessObjects Explorer 3.2 installed and fully operational

To make it easy to follow I will make use of the eFashion universe and we will need to create users in BO according with the list of values of Name of Manager dimension (Store -> Store Details->Name of manager).Note that the name of the users should be exactly the same as the values of the dimension.

We will create a new space based on the eFashion universe information. The personalization rule is that the Store managers will have access to the space but they will only be able to see the information related to their Store(s).

Creating the e-Fashion Reference space

First open SAP BO Explorer and login with administrator credentials. Click in Manage Spaces, select e-Fashion Universe and press New

In the tab Properties introduce a Name, in our case eFashion Ref, and select a folder under Public Folders, for the example Public Folders -> Explorer Spaces

The users should not be able to access this space, so remember to uncheck the option Show on Home Page

In the tab Objects select the objects that we will use in the space, in the example this tab will look like this

Then click Validate the space and then OK to save the space

Now you will have to Index the space, to do this just press the Index buttonOnce the status check shows the following symbol the space is successfully indexed.

Creating e-Fashion Personalized Space

Now we will implement the space to be accessed by the users, in this space we will make use of the eFashion Reference space created before to build a space with the personalization rules defined.

Log in with Administration rights into SAP BO Explorer, go to Manage Spaces, select the eFashion universe and press New. In the tab Properties introduce a Name, in our case eFashion Pers, and select a folder under Public Folder, for the example Public Folder -> Explorer Spaces

Select the same objects that we have used to create the eFashion Ref space

Go to tab Personalization, check Personalize information space Exploration and Select the eFashion Ref space from the list Select an information space

Now select User, from the table To Filter, and select Name of the Manager in the drop-down list in the column Filtered By.

We will link the rest of the dimensions of the personalized space with their corresponding ones on the reference space. The Personalization tab should finally look like this:

Validate the space and press Ok to save it and Index the new space eFashion Pers

Security Topics

Before testing the solution, and to avoid strange behaviors of the SAP BO Explorer spaces, we will have to review the security applied to the different components involved in SAP BusinessObjects. To “make our lives easier” I suggest creating a User Group (i.e. Explorer Users) in SAP BO and I strongly recommend reviewing this list of topics to ensure that the group has:

  • Granted access to Explorer application
  • Granted access to the Universe
  • Granted access to the Connection used on the universe
  • Granted access to the folder where the spaces will be stored.

In this example, what I did was to grant View On Demand access to all of the items of the list.

Finally the solution is ready to test!

Testing the solution

Log on in SAP BO Explorer with one of the users we have created, i.e. Quinn, from the Home tab we will access the eFashion Pers space and see only the data belonging to manager Quinn

If you log on with another user created, i.e. Steve, from the Home tab we will access the eFashion Pers space and see only the data that belongs to Steve

I hope you found this article interesting. For any queries regarding the contents of this article please leave a comment and I will readily reply.

SAP BusinessObjects Mobility Solutions (Part 2 - SAP BI Mobile)

This is the second article of the SAP Mobility Solution series.  It is time to review the second Mobile application that has been release by SAP Business Objects: SAP BI Mobile

If you have not  read the first article on SAP Explorer yet, check it out.

Just as a brief reminder that both this and the previous tool can be downloaded (if you are an SAP partner) through SAP Marketplace

If you are not an SAP partner but still feel like trying these tools you can still download the mobile applications from the app store and try out the demo servers SAP has made available.

Now let’s start reviewing the second Mobile tool from SAP Business Objects

SAP BI Mobile

The SAP BI Mobile application allows WebI and Crystal reports to be displayed and distributed through Mobile devices. The application we will review here is the Ipad version but other mobile devices are also supported. The Ipad version of this application can only be installed if you have Business Objects XI 3.1 SP3 or higher, so be prepared to patch your system if it is not at this level.

Click Here to find a complete overview of this application.

The first step to get this application running is to install the server side of the software. To do so you need to download two files from the SAP Marketplace: the BI Mobile 3.1 SP3 file and also the BI Mobile SP4 (required for Ipad support)

Installation

The installation is also straightforward and you should only modify the default settings of the install if your Business Objects system configuration requires it.

For example, if you have a web server separated from the application server then you will have to install those two sides separately (Custom Install). In our example, since all the components are on the same machine we will install all the software on the same place (Complete Install).

You can see in the screen below how components are separated in the install process.

Once you run through the install for the BI Mobile SP3, you will also need to install SP4. This patch installation does not require any configuration and will only write the patched files on the home business objects directory.

After these two installations are complete you will notice new applications are installed on the server components of you Business Objects system.

Run both of the Configure as a service options (only on windows install) so you can also have the BI Mobile components available as services under windows.

Make sure your new Mobile services are started and remember to set them to start automatically in case they need to remain ON along with the Business Objects system.

Deploying Web Components

The web part of the BI Mobile application has also been generated during installation but for some reason they are not automatically deployed (at least in our test cases). Therefore you will need to move them yourself to the Tomcat webapps directory so they are deployed.

Browse to the following directory: $BOBJ_Home/Business Objects 12.0/java/

Locate the following files:

  • MobileBIService.war
  • MobileOTA.war
  • MOBIServer.war

Copy these files to the webapps directory located at: $BOBJ_Home/Tomcat55/webapps

When the .war files are copied to this directory they will be automatically picked up by Tomcat and new directory apps will be created. If the deployment is successful you should be able to access the Mobile default web page at:

http://yourserver:8080/MobileOTA

If a webpage comes on with options for different mobile devices, we are now ready to install/configure the mobile application on the ipad.

The Mobile Application

First off, we need to download the application from the App Store. You would find it under the name SAP BI Mobile (do not confuse with Mobile One app)

Once downloaded, it is time to configure the settings for a new Mobile connection.  Start the app on the Ipad and click on the Settings option at the bottom.

Select the "add a connection" option where you will have to provide the following:

  • Connection Name
  • Server URL. This is the name:port of the machine where the BI Mobile web component has been installed (without http in front)
  • The CMS name that controls the BI Mobile server components
  • The Authentication method
  • Username and Password

Save the configuration and select the newly created connection.

If the connection is successful we will face the following screen on the Ipad application.

The connection to the mobile server has been successful but we have no reports to show yet. To make new reports available to the mobile application we will have to tag them as mobile compatible. This is done by adding the reports to a category called Mobile. This category can be customized as desired but for this example we will use the default value.

Select the reports we want to make available on the BI Mobile application and categorize them as Mobile.

NOTE: In most cases the category does not previously exist and you might need to create it prior to this step.

Almost immediately after this is done, you will see the categorized reports appear on the lower part of the BI Mobile application.  The reports are now ready to be downloaded to the Ipad.

Click on the green download button that appears next to each report.

When the download is completed the downloaded report will appear on the upper part of the BI Mobile application. We can now click on the report on the upper part and you will find the Mobile version of your WebI/Crystal report.

Be aware that not all WebI capabilities are supported by the BI Mobile version. To understand the limitations you can review the product guide here

On the same document we can also find some useful best practices on how to design a WebI/Crystal report for Mobile viewing and templates that can help you when designing new reports according to mobile devices´ size.

Although the variety of graphs and interaction in the BI Mobile application is still quite basic, we think SAP is in definitely on the right track.

Appendix on Business Objects XI 4.0

Although our example reviews version 3.1 of the Mobile application we also advise to review the guide for release 4.0 as it contains additional features on the BI Mobile application. The additional features include in-table graphics such as percentage bars or sparkline trends. See screenshot below:


Conclusion on SAP BusinessObjects Mobility Solutions

This is a promising start. Chances are that  soon SAP will extend the devices covered, support more complex graphs and take better advantage of the Ipad interaction capabilities as well.

With mobile solutions you will be able to optimize your existing investment by bringing your content to more mediums, you will be able to provide instant answers to more people, no matter where they are working from, therefore, you will boost the performace of your organization. All bets are on mobility!


If you are interested or have worked with this application, or if you feel it might be useful in your organization, please leave a comment below.

Clariba and SAP MENA Invite you to attend our Finance Central Webinar (MENA BI Webinar Series)

SAP MENA and Clariba would like to invite you to attend our Finance Central Webinar on Monday, 16th of January - 2012, from 14:00 to 15:00 (UAE local time) to learn more about the benefits of our solution. (Presented in English)

To Register for the Webinar CLICK HERE

We officially open our MENA BI Webinar Series with the first webinar about Clariba Finance Central, an interactive and user-friendly solution, which centralizes all financial information in one dashboard allowing for extended analysis in a highly visual format, putting instant power in the hands of the CFO. With this single version of the truth, your finance department can visualize all relevant financial KPIs and perform easy comparisons with budgets and performance targets.

The solution was developed using leading SAP BusinessObjects BI technology and can be integrated with any data source and adapted for any industry. Moreover, it can be incorporated into your company’s Microsoft Office and mobile devices, allowing for easy access to historic and current data.

The Webinar will have the following Agenda:

  • Welcoming & Introduction by SAP MENA
  • Clariba Finance Central:
    • Challenges of Finance departments
    • Benefits of our solution
    • Interactive Demo
  • Presentation of SAP BusinessObjects suite by SAP MENA
  • Q&A

To Register for the Webinar CLICK HERE

For more information about our SAP BusinessObjects solutions for Finance Departments, visit our web site to view a demo video about Clariba Finance Central: Click Here Best Regards, Xavier Marigó Clariba Sales Manager MENA


SAP BusinessObjects Mobility Solutions (Part 1 - SAP Explorer)

As you might have already noticed we live in a mobile world. The increasing use of mobile devices for everyday tasks has become a common place in the course of the last decade. Business Intelligence has not fallen behind on this trend. On this series of two blog posts on SAP Business Objects Mobility Solutions, we will analyze mobile applications that SAP Business Objects has made available to bring BI to mobile devices (more specifically the Ipad): SAP Explorer and SAP BI Mobile.

Through this analysis we will learn what is the process to install the applications and review a few important things we need to consider. We will focus only on their mobility piece (Explorer for example can also be accessed on non-mobile devices) and we will also review some details of server side installation for each tool.

Both of these tools can be downloaded through SAP Marketplace (if you are an SAP partner).

If you are not an SAP partner but still feel like trying out these tools you can download the mobile applications from the app store and try out the demo servers SAP has made available.

First off, let us give you some details on our test environment and the software that was installed in it.

Software:

Business Objects XI 3.1 SP3 Enterprise

  • SQL Server 2005

  • SAP Explorer 3.2

  • BI Mobile 3.1 SP4

Hardware (Virtual Machine):

  • Windows Server 2003

  • 4GB RAM

  • 2 processors

  • 30 GB hard drive

With the above setup ready let’s start with our first Mobile tool from SAP Business Objects.

SAP Explorer

This is the first SAP tool based on in-memory technology. It is aimed for casual users who require an agile and pre-built framework for reporting but that still allows them to filter and search data intuitively. It was initially released as a web application only but the mentioned characteristics make it an obvious candidate for mobile devices, so the mobile application came out shortly after.

Once you have the installer files downloaded from SAP Marketplace it is time to install it on our Business Objects environment.

Installation

The installation of SAP Explorer is pretty straightforward. You will find that there are very few screens that we need to pay full attention to and these are the ones we will focus on during this post.

You would install the application and web server components together or separated, depending on your system configuration. In our example we will install the whole product on a single machine.

For environments where the web server is not located on the same machine you will have to install independently the Web Application Server Component in the list above. However, it is also possible to install, for example, the indexing server on a separate machine to optimize efficiency. The index server is the one in charge of generating the space and might require a heavy load of processing power depending on your configuration.

Administrator credentials will be required during installation, so make sure you have them handy, as well as CMS name and port.

Finally the node name will be requested. This is used to identify the installation in multiple/parallel Explorer setup. For example, to link an isolated indexing server to its Master server. In our case we will leave the node name with the default name (which on this case is the computer name) as all of our installation resides on the same place.

Once the installation is complete we can test it by accessing the following url: http://yourserver:8080/polestar

If everything is setup correctly you will see the login screen for Explorer.

NOTE: If you would like to review the installation process in more detail it is best to review the Installation Guide also available in the SAP Marketplace.

Creating and Configuring a Space

Next step is to create a space.  The space is the indexed data that Explorer builds based on a Universe or File. To build it we will need to do the following:

  • Login to SAP explorer

  • Click on the Manage Spaces option

  • Select a universe

  • Select New

Provide the necessary information to build the space. We will need to provide at least:

  • Space name

  • Storage location

  • The dimensions and facts that will be computed on the space

Once the space has been configured we now need to index it. This process can be executed on demand or it can be scheduled, as a one time only or recurrent event. Depending on the size of the data selected from your universe this process might take from minutes to hours, so be aware of this before long running queries are configured to build a space. Once the space has finished indexing its data it will be marked with a green check.

Now we can plugin our mobile device to the space!

The Mobile Application

Before we plugin your device, first we need to download the application from the app store. We will find it under the name "SAP Explorer".

Once downloaded we need to configure a new connection with the following details:

  • Connection Name

  • CMS System name

  • Username (with permissions to use Explorer)

  • Password

  • Type of Authentication

There are no complex requirements on this configuration screen. Just make sure you provide the correct data for each component (web server, cms, cms port, etc).

NOTE: the official SAP Explorer Mobile installation guide specifies that installing SAP BI Mobile servers is a requirement. In reality, this is only optional and by installing SAP Explorer server you should be able to access Explorer with your mobile device.

You should now be able to start the connection to the Explorer server and work with the space created before. On this example we will use the SAP Experience connection that comes configured by default on the Ipad application.

If the connection is successful you should find the following screen listing all available spaces:

Once a space is selected from the list we would face a screen that looks pretty similar to what you have seen in the web version of Explorer.

The mobile version of SAP Explorer has no differences on functionalities against is Web-based version and only minor changes have been done to adapt for touch interaction on the Ipad.

As you have seen, installing and preparing SAP Explorer Mobile is a no-brainer.  Run through the installation process and you are setup to start using spaces and in-memory analysis on the Ipad.

As of now there are no other apps released by SAP for other mobile platforms (i.e. Android). Some might say this is not necessary due to other platforms support of flash technology, but the responsiveness of the Ipad application definitely sets this version appart. We hope to see dedicate applications to come out for other mobile devices soon.

The next mobile application - SAP BI Mobile - will be covered in the next article of the series, that should be out in early January.

If you are interested or have worked with this application, or if you feel it might be useful in your organization, please leave a comment below.

StreamWork – the Collaborative Work Environment from SAP

We are noticing that our customers and potential customers are starting to look for collaborative models and workflows. The reason is that they want to foster and improve teamwork and reduce human errors by creating approval flows for their internal tasks. So, if yesterday the power users or IT could directly modify the values of a database without any control, today, with an increasing number of employees and a growing level of complexity for processes, they prefer formal workflows to drive efficiency and always ensure the approval of the management, a collaborative model that can reduce or even eliminate errors coming from lack of control on actions.

SAP does not yet have any workflow engine (or at least we are not aware of it), but we have what SAP calls “Social Intelligence” tool, which is called StreamWork.

This solution looks like a mix between Facebook, Twitter, LinkedIn and MS Outlook/Projects. I have taken some print screen images during the tests I have done in one of our clients, so you can see what is available:


Users can create tasks/activities and add participants;


Add actions to different tasks;


Manage feeds and control what they are following;


Set agendas and RACI matrices;


Define notification settings and get email reminders on their inbox…


…in a few words: they can collaborate while they work on a project.

If you want to access a free version of StreamWork, please go to www.streamwork.com and sign in. Moreover, you can find a white paper attached sap_streamwork, where you can read what SAP says about it. In my opinion, a very interesting tool, worth checking it out.

Le Invitamos A Registrarse En Nuestro Webinar: Control del Tráfico de Llamadas Clariba - el Próximo 12 de Diciembre

SAP y Clariba le invitan a registrarse en el segundo Webinar de Control del Tráfico de Llamadas para conocer más sobre los beneficios de implementar una solución de atención al cliente en tiempo real.

Visualización del Call Center en tiempo real


Su Centro de Llamadas y de Atención al Cliente juega un papel importante en el proceso de venta e influye directamente en la experiencia del cliente. Cuando nos encontramos en un pico de llamadas, aumenta el tiempo de espera, los clientes están insatisfechos y los directores de equipo necesitan poder asignar dinámicamente los agentes. También necesitan encontrar la causa raíz de cualquier ineficiencia para marcar el camino adecuado, como la formación del personal o la gestión del proceso.

SAP y Clariba le invitan a registrarse en el siguiente Webinar de Control de Tráfico de Llamadas para conocer más sobre los beneficios de implementar una solución de atención al cliente de tiempo real. El primer seminario ha tenido mucho éxito por eso hemos decidido volver a presentarlo el 12 de Diciembre de 2011, de 11:00 – 12:00.

El Control de Tráfico de Llamadas de Clariba está basado en la tecnología BI SAP BusinessObjects. Actúa en tiempo real y es la solución más atractiva que permite a los centros de llamadas y atención al cliente mostrar de forma autónoma los parámetros clave del tráfico de llamadas, las alertas de servicio y las tendencias de hasta 5 equipos simultáneamente en una única pantalla. Esto a su vez se puede mostrar en una gran variedad de dispositivos, desde las pantallas de gran formato en su oficina a los dispositivos móviles. Además, está totalmente automatizada, proporcionando información fiable y actualizada para la toma rápida de decisiones.

Para que conozcas esa solución, nos complace invitarle a nuestro Webinar con la siguiente Agenda:

  1. Bienvenida y Introducción
  2. Caso de Éxito: Departamento de Atención al Cliente para un gran cliente de Telecomunicaciones
  3. Demostración del Control de Tráfico de Llamadas de Clariba: Beneficios y Funcionalidades
  4. Presentación de la suite SAP BusinessObjects
  5. Turno de Preguntas

Asista a la próxima sesión:

Lunes, 12 de Diciembre de 2011 – 11:00 a 12:00

Regístrese Ahora

Para más información acerca de nuestras soluciones SAP BusinessObjects para departamentos de atención al cliente, visite nuestra web dónde podrá ver un video resumen sobre el Cuadro de Mandos de Tráfico de Llamadas de Clariba.


Saludos cordiales,

Marc Haberland

Director General

Clariba


Webinar – Clariba Traffic Control - Real time insight for Call Centers


SAP and Clariba invite you to register to our Clariba Traffic Control Webinar on December 12 from 11:00 – 12:00 (CET) , to learn more about the benefits of implementing real time Customer Service solution. Please note, this webinar will be held in Spanish.

Call Centers and Customer Service Departments play an important role in the sales process and are influential in shaping the customer experience. When call volumes spike, wait times increase or customers become dissatisfied with their experience, team managers need a way to dynamically reassign agents to meet changing call loads and management needs a way to drill down to the root cause of any inefficiency to find the appropriate course of action, such as retraining or process changes.

SAP and Clariba invite you to register for the Traffic Control Webinar to learn more about the benefits of implementing a real-time customer service solution. The first webinar was highly successful, therefore, we have decided to present it again on the 12th of December 2011, from 11:00 – 12:00.

The Traffic Control solution is based on the most integrated stack of SAP BusinessObjects technology. It is a reliable, real-time and eye-catching solution which allows Call Centers and Customer Service Departments to autonomously display key call traffic metrics. This in turn can be displayed on a variety of devices, from large screens throughout the office to hand-held mobile devices.

The Traffic Control webinar agenda includes:

  1. Welcome and Introduction
  2. Case study: Call Center Department for prominent Telco customer
  3. Demo: Traffic Control Benefits and Features
  4. SAP BusinessObjects tools and implementation
  5. Q&A

Attend this session:

Monday 12th December 2011, from 11:00 to 12:00

Register Now

For more information about our SAP BusinessObjects solutions for Contact Centers, visit our website to view the short 3 minute video about Clariba Traffic Control


Best Regards,

Marc Haberland

Managing Director

Clariba


Make way for SAP HANA

Last month, I had the chance to attend the SAP HANA Training Bootcamp in Dubai (UAE). This was my first opportunity, after a lot of expectation and whitepapers, to put my hands on a real SAP HANA machine and the expectation were met.

Let’s start with the impressive hardware improvements that have led us to the In-memory computing revolution.

1
1

It’s not difficult to understand that the slower part of a database access is reading data from the disks. This problem has been addressed by the database vendors by trying to use storage optimizations, faster hardware, and other techniques but ultimately the database management system needs to read data from the disk. So here the great idea came to play… What if I can store all the data in memory?

Not so long ago, when our server processors were 32 bit, we were only able to address 4GB of memory, so that was the maximum amount of memory we cold have in our server. Nowadays with the 64 bits architectures we are able to access up to 2 TB.

In addition to the huge amount of principal memory we can have in the server, thanks to the massive parallel architectures (currently we can have up to 64 CPU Cores per server) we can apply a lot of optimizations that reduce data size and increase access performance. These are:

  • Data Compression
  • There is no need to use aggregate tables reducing data storage requirements.
  • We can use table partitioning to increase data access speed.

All of this gives us a near to immediate query response time, even with queries involving billions on rows, and believe me, this is not just a Marketing stunt… I have seen it ;)

2
2

So far we have seen why it is interesting to use In-Memory computing and why do it now, but, how do we manage SAP HANA Appliance?

The core for SAP HANA Appliance administration is SAP HANA Studio. Using this tool we are able to:

  • Model our information; these models are used to create multiple views of the transactional data.
  • Preview data from both physical tables and the previously mentioned Information Models.
  • Import and export data
  • Configure data provisioning (initial table loads and replication)
  • Manage the system security

I hope you have enjoyed this overview of SAP HANA appliance. Very soon I will come back with a post on SAP HANA connectivity.

If you have any questions or opinions about SAP HANA appliance, please leave a comment below.