""

SAP BusinessObjects

Providing SSM data to SAP BusinessObjects reporting tools - Exhausting all scenarios

In the last two months I have been in a couple of customers who were interested in the integration of SAP Strategy Management 10.0 with SAP BusinessObjects BI Platform 4.0. In this post I would like to explain what that integration is about.

First of all, a brief introduction about the solution. The SAP Strategy Management (SSM) software allows aligning the Strategy Plan of the company and its key objectives and spread it across all the organization. It is an out of the box Enterprise Performance Management solution in which you can insert the most important KPIs of your company in Balanced Scorecards or Strategy Maps and control their performance in relation to the Strategy of the company. Within SSM you can also create initiatives to implement improvements or corrective actions and link them to the objectives or KPIs.

Sometimes the customer has requirements to implement reports or further analysis on top of SSM and these cannot be covered with the standard functionality of the solution. In that case, the best option is to implement the integration between SSM and SAP BusinessObects reporting tools. Some examples of what you can do with that integration:

  • Implement bespoke Dashboards with your SSM KPIs and Objectives
  • Implement universes and allow users to exploit information from SSM with Web Intelligence without consuming additional SSM licenses
  • Implement pixel-perfect Crystal Reports on top of the SSM
  • Foster ownership with Publications. For example, send a list of KPI’s that are not performing well to their responsible users

For implementing such integration, you can follow the SAP SSM Configuration guide. However, in some cases, there is lack of documentation and you have to do things outside the script. In other cases, the existing documentation has not been updated yet to BI 4.0 and SSM 10.0. And finally, sometimes the documentation is wrong or the software has bugs and you cannot setup the integration.

In this post we will analyze following scenarios:

  1. Web Intelligence reporting on top of a SSM Models
  2. Web Intelligence reporting on top of a SSM Data Model (Clariba-developed solution)
  3. Crystal Reports on top of SSM (exploring different options)
  4. Dashboards on top of SSM (exploring different options)

These scenarios have been implemented with following software components:

  • SAP NetWeaver 7.3 SP08
  • SAP SSM 10.0 SP06
  • SAP BusinessObjects BI Platform 4.0 SP05
  • Crystal Reports 2011 SP05
  • Dashboards 4.0 SP05

1. Web Intelligence reporting on top of a SSM Model

As per SAP documentation, we can setup the ODBO Provider in order to build a Universe on top of SSM Models. The problem is we still have to use the Universe Designer instead of the Information Design Tool of the BI 4.0. Bellow are the steps for setting up the ODBO Provider and implementing your first report on top of the SSM:

  • Go to your BO 4.0 server and make sure you have a Multimensional Analysis Service in the BO server. Stop the MDAS Server and the Connection Server in the Central Configuration Manager
  • Copy the ODBOProvider folder from the <drive>:Program files (x86)SAP BusinessObjectsStrategy ManagementInternetPub path of your SSM server to the BO server
  • In the SSM server, run the SSMProviderReg.bat file in the BO server. Make sure you have administrator rights in the BO server. Once completed, check in the regedit that you are able to find the register SSMProvider.1 in the Windows register
  • Modify the windows register to insert following string in that path (assuming that you are using a 64-bit Windows): HKEY_LOCAL_MACHINESOFTWAREWow6432NodeSAPSSMODBOProvider "servletUri"="/strategyServer/ODBOProviderServlet"
  • Access the following path in BO server: <drive>:Program Files (x86)SAP BusinessObjectsSAP BusinessObjects Enterprise XI 4.0dataAccessconnectionServeroledb_olap

<DataBase Active="Yes" Name="Strategy Management 10.0">

<Aliases>

<Alias>Strategy Management 10.0</Alias>

</Aliases>

<Library>dbd_sqlsrvas</Library>

<Parameter Name="Family">SAP BusinessObjects</Parameter>

<Parameter Name="Extensions">sqlsrv_as2005,sqlsrv_as,oledb_olap</Parameter>

<Parameter Name="MSOlap CLSID">SSMProvider.1</Parameter>

</DataBase>

  • Start the MDAS Server and the Connection Server
  • Now we can go to the Universe Designer and start implementing a Universe on top of our Model. The first step is defining the connection. In the connection list (retrieved from the Connection Server) we can see now the new register we have inserted, Strategy Management 10.0:
  • Define the connection parameters. You must be an SSM user with proper permissions and you must inform the server's complete address (FQDN) and its port.
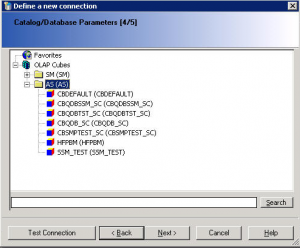
  • Once connected to the SSM server, you will see the list of available Cubes. The AS category allows access to the measures (based on attributes and dimensions) in the Application Server model.The SM Adapter allows access to the strategy dimension, which represents the strategy management dimensions Scorecard and Initiative. Scorecard detail not relating to the KPI such as comments are not presented.
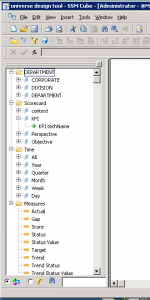
  • And finally we will see our universe with the available dimensions, the standard classes (Time and Scorecards) and the measures. You can display the technical names of the objects as detail or you can define hierarchies of Perspectives, Objectives and KPIs.
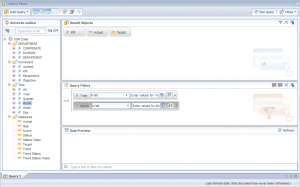
  • Now we can publish the universe and go to the Web Intelligence to start implementing our reports on top of the SSM models.

2. Web Intelligence reporting on top of SSM Data Model

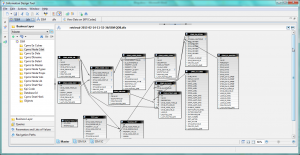
That is a solution you can implement if you have an advanced knowledge of the SSM Data Model. You can implement a UNX Universe with the Information Design Tool by linking all the tables of the Entry and Approval, the Nodes of the Scorecard, the Cube Builder or the Initiatives. The advantages of that option is that you have access to extra information not available in the SSM Cube,  such as the Initiatives, the users related to specific KPIs, the attributes of the KPIs etc.

If you are interested in such an option, please, contact us. Keep in mind that it is not a supported option from SAP but we have implemented it many times and we know it works.

3. Crystal Reports on top of SSM

The integration of SAP Crystal Reports with SSM can be done by 4 different ways:

  • Implementing a Query as a Web Service from the Universe, built in previous steps: we have managed to implement that scenario
  • Connecting Crystal Reports to the Universe on top of the SSM Models we have built in the first step: that scenario is not working although we followed the instructions from SAP
  • Using an OLE DB (ADO) connection: this option, not explained by SAP, is available if we install the ODBO provider but we have not managed to make it work
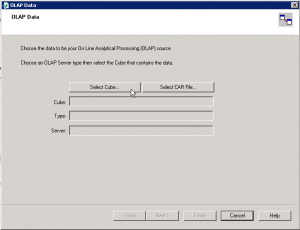
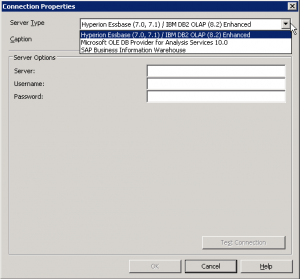
  • Using the OLAP Connection: according to SAP Documentation, we can build an OLAP Cube Report in Crystal Reports. We should be able to select the Strategy Management option in following screen to inserts SSM connection data, but we have not been able to find that option

4. Dashboards using Web Services Connections

Using Dashboards, you have two different ways to implement the access to data:

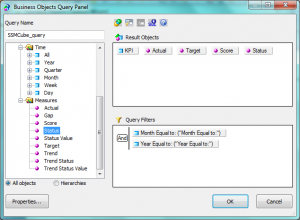
  • Implement a Query as a Web Service (QaaWS) to retrieve the relevant information from the Universes we had implemented before.
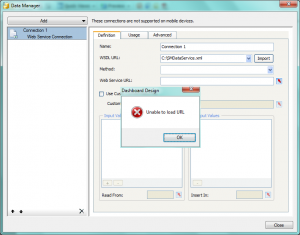
  • Use Web Services available in the SAP NetWeaver to retrieve information from the SSM:  according SAP documentation you need to download the WSDL file SMDataServiceService and CubeServiceService applications and call the functions within them. With our Dashboards 4.0 SP05 we have not been able to process the WSDL files as the tool is unable to load the URL.

Summary

Providing SAP Strategy Management information to SAP BusinessObjects BI Platform 4.0 can enhance the capabilities of your Strategy system. However that integration is not so easy given the lack of information on that topic and the quality of the existing information. We tried to implement all possible integration scenarios and we have succeeded with Web Intelligence and this is the route we recommend  as the scenarios related to Crystal Reports and Dashboards the integration were not working when using SSM 10.0 and BI 4.0.

We will be following-up these issues and let you know if we finally manage to solve them. If you have any suggestions or if you found a workaround to these issues please leave a comment bellow.

Using Google Chrome with SAP BusinessObjects

We all know that there are many internet browsers available, but definitely Google Chrome is one of the most used nowadays and therefore we have had a lot of feedback from our customers related to using chrome with SAP BusinessObjects.

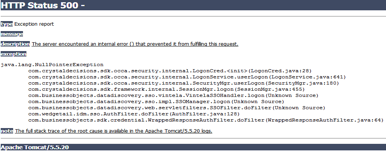
A main problem found by users is that when using Google Chrome on InfoView or BiLaunchPad a missing plug-in error screen appears when you are trying to modify a report and it also shows a HTTP Status 500 error screen when trying to log in to SAP BusinessObjects Explorer. In this blog I will provide a solution these issues.

Issue when login to InfoView or BILaunchPad in GoogleChrome
Issue when accessing SAP BusinessObjects Explorer

The solution we have found is to use a Google Chrome add-on called “IE tab”, which emulates Internet Explorer on Chrome.

Steps to install it:

  1. From Google Chrome, introduce the link in the url bar and install the add-on.                                                                                       https://chrome.google.com/webstore/detail/hehijbfgiekmjfkfjpbkbammjbdenadd
  1. Once installed you will see a small folder with the IExplorer logo on the top right corner of google chrome.
Folder with Explorer logo
  1. Click on the folder and another url bar will appear
URL bar appears
URL bar appears
  1. Introduce the Infoview / BI LaunchPad link in the new bar and start working with it.

Moreover, in case you need to click on an Open Document link and you want Google Chrome to be opened up automatically with it you will need to add your server’s url so it can open successfully, for this you need to follow these steps:

  1. Right click on the small folder with the IExplorer logo
  1. Choose Options
  1. Add the server’s address text in the Auto URL’s field

The outcome

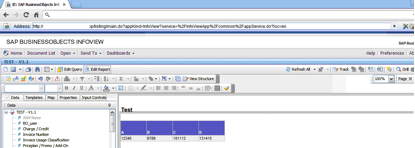
SAP BusinessObjects web based applications can be successfully used with Google Chrome, see below the following examples:

Modifying a report on InfoView
Viewing and managing spaces from SAP BusinessObjects Explorer

Summary

The main benefits of applying these tips are, with the help of Google Chrome:

  • Modify documents on Infoview / BILaunchPad
  • Log in and manage spaces in SAP BusinessObjects Explorer
  • Increase the speed of navigation while going through the platform folders

According to the SAP’s official PAM (Product Availability Matrix), Google Chrome is not entirely supported due to its fast development speed, so the use and frequent update of this add on is highly recommended.

Hope this will help you have a better experience when working with SAP BusinessObjects. If any doubts or suggestions please leave a comment below.

How to configure SQL Server connectivity for WebI from SAP BusinessObjects BI4.0 in Linux

Nowadays we have noticed some of our customers are following the trend of open source products. Indeed, Linux is a great choice of operating system due to the fact it is totally compatible with SAP BusinessObjects BI 4 and it also help companies to cut costs.  However, Linux has retained the way the classical Unix operating system works and therefore everything is about rights and batch commands. Therefore an advanced Linux technical know-how is compulsory before getting into it.

The purpose of this blog entry is to share the issues we faced in one of our customers running SAP BusinessObjects BI4 SP4 in a Red Hat Enterprise Linux Server release 6.3 using MySQL 5.1.61 as the system database and how we solved them.

The issue came out when right after a production database migration (a brand new SQL Server 2008) all their WebI documents stopped running from the SAP BI4 Launchpad with an unusual error "Database Error .[ (IES 10901)" blocking every single WebI to run and the whole core business was jeopardized. Rich Client did not experience any problem in Windows. After the first analysis, we discovered that default SQL Server ODBC driver installation was only configured properly for 32bit connections in the Linux server whereas WebI requires 64bit ODBC driver connectivity for running in the SAP BI4 Launchpad.

When it came to this point we had to apply a couple of OSS notes. The first one was OSS 1607125 "How to configure SQL Server connectivity for WebI from a BI4.0 unix environment". Resolution is:

1. Open env.sh under <install directory>/sap_bobj/setup/

2. Search for the following line

LIBRARYPATH="$LIBDIR:$LIBDIR32:$WCSCOMPONENTDIR:$PLUGINDIST/auth/secEnterprise:${CRPEPATH64}:${CRPEPATH}:${MWHOME}:$PLUGINDIST/desktop/CrystalEnterprise.Report:${BOBJEDIR}enterprise_xi40/$SOFTWAREPATH32/ras:${BOBJEDIR}mysql/lib”

3. Modify the line above by adding the following

":${BOBJEDIR}enterprise_xi40/linux_x64/odbc/lib:${BOBJEDIR}enterprise_xi40/$SOFTWAREPATH32/odbc/lib"

The line should look like this

LIBRARYPATH="$LIBDIR:$LIBDIR32:$WCSCOMPONENTDIR:$PLUGINDIST/auth/secEnterprise:${CRPEPATH64}:${CRPEPATH}:${MWHOME}:$PLUGINDIST/desktop/CrystalEnterprise.Report:${BOBJEDIR}enterprise_xi40/$SOFTWAREPATH32/ras:${BOBJEDIR}mysql/lib:${BOBJEDIR}enterprise_xi40/linux_x64/odbc/lib:${BOBJEDIR}enterprise_xi40/$SOFTWAREPATH32/odbc/lib”

4. Navigate to <install directory>sap_bobjenterprise_Xi40

5. Open odbc.ini file using vi or other text editor tools.

6. Find the entry for Sql Server DSN.  The default DSN entry in the odbc.ini is called "[SQL Server Native Wire Protocol]" but it's recommended that you create your own DSN entry using the same parameters specified in the default DSN.

7. Update the "Driver" section of the DSN to point to 64 bit version of SQL Server ODBC drivers

Driver=<install directory>/sap_bobj/enterprise_xi40/linux_x64/odbc/lib/CRsqls24.so

8. Restart the SIA

However the issue was not resolved completely. We received a new error with the following description whenever we tried to run a WebI "Receive the error : Database error: [DataDirect][ODBC lib] System information file not found. Please check the ODBCINI environment  variable.. (IES 10901) (WIS 10901)". This is a configuration issue on the Linux operating system with the environment variable ODBCINI.  Please make sure your environment variables are set correctly according to OSS note 1291142 - "Web Intelligence reporting using DataDirect drivers in Unix" (as of today it still applies to BI4). Resolution is:

1. In the Bobje user's Unix profile, add/modify the following environment variables and source the profile

BOBJEDIR=<install_path>/bobje export BOBJEDIR ODBC_HOME=$BOBJEDIR/enterprise120/<platform>/odbc export ODBC_HOME ODBCINI=$BOBJEDIR/odbc.ini export ODBCINI LD_LIBRARY_PATH=$BOBJEDIR/enterprise120/<platform>/dataAccess/RDBMS/connectionServer:$       ODBC_HOME/lib:$BOBJEDIR/enterprise120/<platform>/:$LD_LIBRARY_PATH export LD_LIBRARY_PATH

NOTE: For AIX replace LD_LIBRARY_PATH with LIBPATH, For HP-UX use SHLIB_PATH NOTE: Replace <platform> with linux_x86, solaris_sparc, aix_rs6000, hpux_pa-risc depending on your specific Linux platform. NOTE: You must set/export the above env variables in the same order as shown.

Please make sure to use the file $HOME/.odbc.ini as your default source for ODBC settings. Therefore, modify the ODBCINI variable in the following way:

ODBCINI=$HOME/.odbc.ini export ODBCINI

2. Modify the odbc.ini to add the DSN

                  [TestDSN] Driver=<install_path>/enterprise120/<platform>/odbc/lib/CRmsss23.so Description=DataDirect 5.3 SQLServer Wire Protocol Driver Address=<sql_server host or ip>, <port> Database=<db_name> QuotedId=Yes AnsiNPW=No

NOTE: Your DSN name (TestDSN) must be the same DSN name you used when creating the ODBC connection in Windows

3. DataDirect provides both NON-OEM drivers and OEM drivers

The drivers provided by BI4 are OEM drivers. Basically the WebI is dependent on the ConnectionServer.  By default the ConnectionServer is set to use NON-OEM drivers. Thus, we edited the connection server to allow the use of the OEM branded DD driver. The steps are:

  • Make a backup copy of $BOBJEDIR/enterprise120/<platform>/dataAccess/RDBMS/connectionServer/odbc/odbc.sbo
  • Open odbc.sbo with VI, search for DataDirect, there are 4 entries one for each MSSQL server we support.
  • Change all 4 from No to Yes <Parameter Name="Use DataDirect OEM Driver" Platform="Unix">Yes</Parameter>

 4. Stop all XI servers

Run ./stopservers, log out completely from your unix shell and log back in (to make sure new environment variables are setup), start all BI4 servers again.

After applying the OSS note we were able to retrieve data from SQL Server 2008 refreshing our WebI documents, however we noticed that CPU was reaching 100% every time we used a WebI in any way. Going through the log files we found errors such as "MS SQL Server 2008 |JobId:61340512 |EXIT SQLGetDiagRec with return code -1 (SQL_ERROR)" .

We took a look at the odbc.ini file and we found out that QWESD entry that was not initially there somehow appeared. As long as we were copying the information from an existing datasource we didn't need it all and we decided to remove the QEWSD=<random string> from the ini file.

Finally double check that <Parameter Name="Use DataDirect OEM Driver" Platform="Unix">Yes</Parameter> located at sqlsrv.sbo file in /opt/bi40/sap_bobj/enterprise_xi40/dataAccess/connectionServer/odbc is set to Yes.

We hope that our experience is a rapid problem solving approach for you. If you have any tips or suggestions to improve this article, please leave a comment below.

Tomcat Upgrade from version 5 to 6 in BOXI 3.x: close the security risk

This post will guide you through the steps on how to successfully make the upgrade of your Tomcat from version 5 to 6 in BOXI 3.x to remove the risk produced by a security hole. The process was done in an environment with Windows Server, SAP BusinessObjects Enterprise XI 3.1 SP3 and Apache Tomcat 5.5. The new Apache Tomcat used was version 6.0.36.

Resolution and steps

All instructions below are using default paths for SAP BusinessObjects and Tomcat 6 installations on a Windows system where the files are put in to “C:Program Files”;  you can change replace these folders with your own ones.

1) Download Tomcat 6.0.x service installer (Where the x is the version that you want).

2) This step is only needed if your SAP BusinessObjects installation does not have the Java JDK installed:

2a) Download the JDK 5.0 Update 22.

2b) Install the JDK 5.0 Update 22 package.

3) Run and install the Tomcat 6.0.x executable. The Welcome screen will appear. Click Next.

4) Click "I Agree" on the License Agreement screen.

5) Select the install type from drop down box & click Next.

6) Enter the destination folder where Tomcat 6 is to be installed. Click Next

7) Enter the user name & password for Administrator login & click Next.

8) Enter the below mentioned path that points to JRE supplied with BOE XI 3.1 (or the JDK in “C:Program FilesJavajdk1.5.0_22” that was installed in step 2). Click Install.

9) Uncheck the "Show Readme" check box. Click Finish.

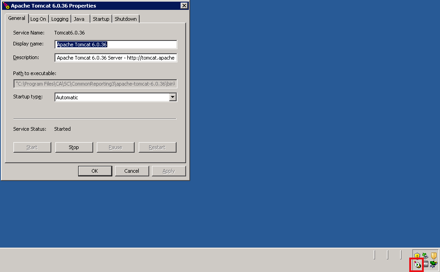
10) Tomcat will now start. There will be a small icon in the system tray as shown below.

Tomcat Icon in the system tray

11) In case that your system is 64bit you can download the Tomcat 6.0.x 64 bit binaries. You need both the tomcat.exe and tomcat6.exe files.

11a) Stop Tomcat and then overwrite your tomcat.exe and tomcat6.exe files in the directory where you installed Tomcat to “C:Program FilesApache Software FoundationTomcat 6.0bin” after backing up the current files.

11b) Start Tomcat service again.

12) Right click on the icon & click Configure.

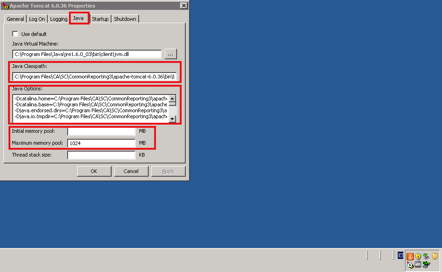
13) The Apache Tomcat Properties screen will appear. Click on Java tab.

Apache Tomcat Properties screen

14) Add the path "C:Program FilesBusiness Objectsjavasdklibtools.jar" in Java Classpath field after the existing entry separated by a semi-colon (;).

15) Add the value 1024 (the value depends on your RAM) in Minimum and Maximum memory pool field.

16) Add the following values in the Java Options field.

-Dbobj.enterprise.home=C:/Program Files/Business Objects/BusinessObjects Enterprise 12.0/ -Xrs -XX:MaxPermSize=512M -Dbusinessobjects.olap.bin= -Dbusinessobjects.olap.stylesheets=C:/Program Files/Business ObjectsOLAP Intelligence 12.0/stylesheets/ -Djava.awt.headless=true -Daf.configdir=C:/Program Files/Business Objects/Dashboard and Analytics 12.0

17) Click on Apply, OK and restart the Tomcat service.

18) Open the file config.tomcat6 in Notepad. It can be located in "C:Program FilesBusiness Objectsdeployment" folder.

19) Uncomment the variable "as_service_name".

20) Assign the following values to the respective variables:

  • as_dir=<installation directory of Tomcat 6>
  • as_instance=localhost
  • as_service_name=Tomcat6

21) The file should look something like this:

##

## Business Objects Configuration Utility

##

# as_dir: the installation directory of the application server

as_dir=C:Program FilesApache Software FoundationTomcat 6.0

# as_instance: the application server instance to deploy to (represents the name of a folder in the conf/Catalina directory)

as_instance=localhost

# as_service_name: on windows, the name of the tomcat service when tomcat is installed as a service

as_service_name=Tomcat6

# as_service_key: on windows, when tomcat is installed as a service, the name of the key where the java startup parameters are stored

# (there is generally no need to touch this)

as_service_key=HKLMSOFTWAREApache Software FoundationProcrun 2.0${as_service_name}ParametersJava

# as_service_key_value: name of the String value where the java startup parameters are stored, in the key pointed to by as_service_key

# (there is generally no need to touch this)

as_service_key_value=Options

22) Save & close the file.

23) Open the file tomcat6.xml in Notepad. It can be located in "C:Program FilesBusiness Objectsdeployment" folder.

24) Make sure that the file has the correct path to the Tomcat6.0.x executable. This path is the one where Apache Tomcat was installed.

<exec dir="${as_dir}/bin" executable="${as_dir}/bin/Tomcat6.0.36.exe" failonerror="false">

25) Assign the right value to the respective variable in case it does not have it.

26) Save & close the file.

27) In the “C:Program FilesApache Software FoundationTomcat 6.0conf” directory create a folder called Catalina. Within the Catalina folder create another folder called localhost

“C:Program FilesApache Software FoundationTomcat 6.0confCatalinalocalhost”

28) Open Command Prompt (Always as Administrator) by clicking Start, Run, type "cmd" and click OK.

29) Change the deployment directory within the SAP BusinessObjects installation path you installed to ("C:Program FilesBusiness Objectsdeployment").

30) Run the command "wdeploy tomcat6 deployall".

31) A BUILD SUCCESSFUL message will appear once deployment of all WAR files is successful. If not, you need to review the failures and correct as needed.

32) Apache Tomcat 6.0.x is now deployed to and configured for usage with SAP BusinessObjects Enterprise XI 3.1 SP3.

33) You can now use the Windows Services management tool or the Tomcat Configuration tool to set Tomcat to automatically start on system boot if you wish.

With this easy guide for the upgrade you should be all set for your installation. We hope that this helps you make a fast transition for your applications by closing the security risk.

If you have any questions or anything to add to help improve this post, please feel free to leave your comments.

Managing ETL dependencies with BusinessObjects Data Services (Part 1)

Are you satisfied with the way you currently manage the dependencies in your ETL? Dependencies between jobs (or parts of jobs) are an important aspect of the ETL management. It pertains to questions like: Do you want to execute job B if job A failed? Imagine that you have a job C with sub-job 1 (usual runtime: 3 hours) and sub-job 2 (usual runtime: 2 minutes). If sub-job 1 was successful and sub-job 2 failed, can you gracefully restart job C without the sub-job 1 being restarted again?

As soon as you have more than 1 simple job, you have to manage your dependencies. In this article (part 1 of a series of articles about ETL Dependencies Management) I’ll first list some of the characteristics I’m looking for in an ideal dependency management system. I will then have a look at some of the possibilities offered by SAP Data Services 4. In part 2 (my next post), I will propose the architecture of a possible dependency management system. In part 3, I will go into the details of the implementation in Data Services. I’ll finish with part 4 by telling you about how the implementation went, and if some improvements are possible.

The ideal dependency management system

In this post I will use the word “process” to design a series of ETL operations that have a meaning together. Example: extract a source table, create a dimension, or update a fact table. The objective here is to manage the dependencies between the processes: updating a fact table should probably only be allowed if updating the corresponding dimensions was successful.

A dependency management system should ideally have at least the following characteristics:

  • Run a process only if its prerequisites ran correctly
  • After a failure, offer the option to re-run all the processes or only the processes which failed
  • Trace the outcome of each process (ran successfully, failed, did not run)
  • Run dependent processes dynamically (rather than statically, i.e. based on date/time)

The possibilities

Let’s enumerate some of the possibilities offered by Data Services, with their respective pros and cons.

1) One job with all processes inside. This is very easy to implement, dynamic in terms of run times, but it doesn’t allow for concurrent runs. Most importantly, it means that failures have to be managed so that the failure of one process does not stop the whole job.

2) One process per job, with jobs scheduled at specific times. This is very easy to implement, allows concurrent runs, but is not dynamic enough. If the process durations increase with the months/years, jobs may overlap.

3) One main job calling other jobs (for example with execution commands or Web Services).

4) One process per job, all the jobs being scheduled at specific times, but checking in a control table if the pre-requisites ran fine. Otherwise they just sleep for some time before checking again.

5) Use the BOE Scheduler to manage jobs based on events (how-to is well described on the SCN). I’ve not tested it yet, but I like this approach.

By default, the first two possibilities only manage the “flow” side of the dependency management (after A, do B). But they do not manage the conditional side of the dependency management (do B only if A was successful). In both cases, a control table updated by SQL scripts would allow the ETL to check if the prerequisite processes have been run correctly.

What I don’t really like in the solutions 2 to 5 is the fact that it’s difficult to have an overview of what’s going on. You cannot really navigate within the whole ETL easily. The solution 1 gives you this overview, but at the cost of having a potentially huge job (without the possibility of processes running concurrently).

Also note that the solutions with multiple jobs will need to manage the initialization of the global variables.

What I miss in all these solutions is an optimal re-start of the ETL. If 10 of my 50 processes failed, and I want to restart these 10 only, do I really have to start them manually?

In my next blog post I’ll propose an architecture that addresses this optimal restart.

Until then, please let me know your thoughts about how you manage your ETL dependencies. Any of the 5 solutions mentioned before? A mix? Something else? And how well does it work for you.

Problems Uninstalling Data Services

I have faced a problem recently and I wanted to share the resolution, in case you have to deal with the same topic. I was trying to upgrade a Data Services machine following SAP procedure (this is copying the configuration files uninstall and then install the new version – not very sophisticated as you can see). This wasn´t as simple as I first though.

Problem started after uninstalling the software, the new version refused to install stating that I should first uninstall the previous version. I uninstalled the software again… but Data Services is still there, so uninstalled again, but this time the process failed (makes sense as the software is already uninstalled), so I kept trying… reboot…uninstall… reboot…rename older path name… reboot…you see where this is going…

So, how did I finally solve this?

  1. Start Registry Editor (type regedit in a command window or in the Execute dialog).
  2. Take a backup of the current Registry content. To do this, with the top node of the registry (Computer) selected go to File -> Export and select a name for the backup file.
  3. Delete the Key HKEY_LOCAL_MACHINESOFTWAREBusiness ObjectsSuite 12.0EIM (Suite XX.X may vary).  NOTE: You may want to write down the key KEY_LOCAL_MACHINESOFTWAREBusiness ObjectsSuite 12.0EIMKeycode first as it contains the license code.
  4. Go to HKEY_LOCAL_MACHINESOFTWAREMicrosoftWindows CurrentVersionUninstall and look for a KEY which property DisplayName is "BusinessObjects Data Services". This step is to remove the entry for the software in the Uninstall Window’s dialog.
  5. Finally delete the content of the installation directory (typically: C:Program FilesBusiness ObjectsBusiness Objects Data Services)

Now you can launch the installer and this time it should work.

Hope this may help you if in case you are experiencing the same issue. Leave comments below if you have any doubts or if you would like to add anything.


Export to Text automation in Web Intelligence

Users typically need their Web Intelligence (WebI) data tables exported automatically into text files in order to use them across other SAP BusinessObjects BI modules. Unfortunately SAP BusinessObjects, including the newest SAP BI 4 release, does not include a direct option to automate the export of content of a WebI document tab to text format. In order to cover this gap and achieve the Export to Text feature for WebI we designed a fully automated process which is shown in this article.

The problem

Users want to automatically export raw data tables from WebI to TXT file, but none of the existing scheduling format options – PDF, XLS, CSV – are satisfying, because:

  • A PDF brings an static document that cannot be re-used directly
  • An XLS or XLSX has the limitation of 65535 or 1 million rows respectively
  • CSV does not export tables, it just exports the Query content

Users of old releases could use the old Desktop Intelligence (DeskI) module as an alternative, but unfortunately it has been discontinued in the new SAP BusinessObjects BI4 release.

The consequences

Users see WebI as an “limited” module in terms of sharing options and export size. Moreover, customers will not migrate to the new SAP BI4, especially those who heavily do Query & Analysis an export the result table to txt using DeskI. The future does not look very promising because:

  • Even if a manual Export to TXT is available since SAP BI4 FP3, automation for it is not currently available and SAP does not have a release date for this feature
  • DeskI alternative is not possible in SAP BI4. Even if a DeskI add-on is planned for coming versions, the future of its scheduling function is uncertain and corporations should not allow DeskI to be part of their BI Roadmap.

The solution

The following method describes a way to schedule a WebI report with Export to text functionality and it involves the use of the following items:

  1. A 1st WebI document with the table to be exported
  2. A Web Service that is pointing to that document table as a source
  3. A 2nd WebI document with just one query that sits on the Web Service created. No tables nor charts are needed here
  4. A vbs script that adapts the output from this 2nd WebI document

Detailed steps to follow for every item are:

  1. The 1st webI document contains all the development needed (Queries, objects, variables, filters) and a table with the final data you would like to export
  2. This 1st WebI document must be edited with WebI Rich Client. Select the table you want to export -> Right Click -> Publish Block -> Create Web Service
  3. The 2nd WebI document which contains the Web Service based query can be scheduled to run with the following options:
    • CSV type
    • Double quote text qualifier, tab column delimiter
    • Export to a server folder (e.g. D:)
    • Name it with txt extension (e.g. Results1.txt)

See below a snapshot with the schedule configuration detail:

Configuration of the schedule in WebI for a txt export

This example is applied to only 1 table to export, but multiple tables per document could be exported by ticking the “Generate separate CSV per Data Provider” option.

Once run with Success, the result of this schedule will be a text file (Results1.txt) with the content delimited by tabs but with a small defect: the so-called text qualifier (double quotes) appears everywhere.

In order to remove this annoying text qualifier (double quotes) a program can be scheduled. You can use your free style but if you copy and paste the following txt into a file called “QuoteRemoval.vbs” it will do the job:

set objRe = new RegExp

objRE.Pattern = """"

objRE.Global  = True

strFileName = "D:Results1.txt"

set objFS = CreateObject("Scripting.FileSystemObject")

set objTS = objFS.OpenTextFile(strFileName)

strFileContents = objTS.ReadAll

objTS.Close

strNewContents = objRE.replace(strFileContents,"")

set objWS = objFS.CreateTextFile("D:Results2.txt")

objWS.Write StrNewContents

objWS.close

The result of this executed script will be a perfectly formatted Results2.txt file

Last but not the least, you can build a system of events that triggers the different items sequentially, or embed these items in an object package that can be scheduled as a whole.

Applicability & Benefits

This method enhances the sharing options for the SAP BusinessObjects platform, allowing an unlimited amount of raw data to exit the platform through WebI automatically, and be re-used in Big Data modules like HANA, Visual Intelligence, Explorer or simply for individual consumption.

Seeing even further, this turns WebI into a real ETL (Extraction, Transformation and Load) tool providing integration capabilities to the end users.

Summarizing, this method:

  • Allows a better integration of SAP BusinessObjects with the corporate BI processes improving efficiency and effectiveness
  • Facilitates companies to opt for a migration to SAP BI4 release, with all the benefits that the newest platform brings

If you have questions about this method, or if you want to share your experience or tips, please feel free to leave a comment.

BI and Social Media – A Powerful Combination (Part 3: Sentiment Analysis)

In previous posts we have covered the role thatGoogle Analytics and Facebookplay in BI projects focused on Social Media Analysis. Therefore, it was only a matter of time before we covered Twitter - the most popular micro-blogging network you can find on the web. Besides that, it will not be rare to find analysts and reviews that consider Twitter the social network that can potentially deliver the highest amount of meaningful information to analyze.At this point, I guess everyone has a general idea of what Twitter is and what it delivers, so the objective of this article will be to make an overview of a Sentiment Analysis showcase that we built extracting data from Twitter with SAP BusinessObjects Tools. Then, in future articles we will cover each phase of the development in more detail. Generally speaking, we consider Sentiment Analysis as the process of identifying, extracting and measuring data from a subjective information source, such as customer surveys, opinion polls, or tweets as in our case.

Data Extraction

As in any BI project, the first step is to define the data that you need, and how to get it. Using SAP BusinessObjects tools, the best way to do this is to develop an Adapter for Data Integrator using the SDK that this tool includes in its installation folders (check this article from SAP SDN that proved to be very helpful).

However, to do the demo as quickly as possible, we used another approach:

  • We developed a Java program that made use of Twitter’s getSearch API to extract tweets and place them in text files Note that for demo purposes this is more than enough, but for a broader project the flat files are not a satisfactory solution.

  • With Data Integrator, we configured an ETL flow to extract the data from the files and store them in database tables to accumulate enough tweets to make the demo meaningful.

Also consider that in this phase it is very important to get comfortable with Twitter’s API and the different parameters that it uses so you can take advantage of it as much as possible.

Data Parsing and Sentiment Analysis

Once we were able to place the tweets in text files and customize the extraction parameters as we desire, then we could actually analyse the tweets to start delivering insight from them. To do so, we followed these steps:

  • Get the raw tweets that we stored in the database before and perform a parsing process with Data Integrator, to get rid of the JSON format that Twitter API uses, enabling us to manipulate the tweets as text strings.

  • Use the feature of Text Analysis that Data Integrator includes to perform the “Sentiment Analysis” process and classify the tweets in one of the different sentiment categories that we used. For the demo purposes that we had there is a SAP Blueprint called Text Data Processing Data Quality that contains Data Integrator jobs with a Voice of Customer implementation that already contains a set of extraction rules implemented for the English language. Therefore, you can make use of this blueprint and its rules to develop the Sentiment Analysis phase.

  • Build a universe on top of the tables with the analyzed data in order to make it available for reporting with any of the SAP BusinessObjects tools that take an universe as data source, e.g. Xcelsius, WebIntelligence, Explorer, etc. In this step, we also made a use of an universe that came included in the same Text Data Processing Data Quality blueprint that we used for the point above.

Data Visualization

Finally comes the eye-catching part: present all the hard work you have done. To show the users how flexible this solution can be, we decided to present the data with Explorer and some Exploration Views built on top of its Information Spaces. However, as said before, if you build an universe on top of the tables that resulted from the Text Analysis process then you will have a great number of possibilities and tools to play with, in order to bring forth the presentation you want according to your requirements and objectives.

In future articles, we will cover each one of these sections in further detail. However, with this general layout we hope you get a good idea of what you need to do to make your Sentiment Analysis demo happen!

If you have any questions or anything to add to help improve this post, please feel free to leave your comments.

Turn data into actionable insight with BI

Making Better Data-Driven Decisions

Do you wish you had a clearer view on the performance of your company and feel you lack key information to guide your decisions? All the Data you gather in different departments is just piling up, isolated and useless? Taking your organization through the current fragile economy is already challenging enough to do it without visibility of what happens in your organization. In order to solve issues and take advantage of strengths you need to turn data into actionable insight. SAP business intelligence software solutions give you the visibility you need to make important business decisions based on key data and facts, not guess-work. They allow you to draw information from data, rather than just storing it for the sake of it.

Interactive dashboards and rich visualizations help you monitor your business performance at a glance, and the real-time insights allow you to adjust aspects of your business before they become a real problem.

Reporting allows you to access and transform corporate data into highly formatted and automatic reports, while interactive reports let you answer ad hoc questions and interact with data, building your own queries.

Analysis solutions help you determine trends from historical data and make better forecasts.

With data explorations tools you can find immediate answers to business questions in a search-engine manner.

With BI application design tools, your IT department will be able to create BI applications for specific audiences.

It´s not necessarily a matter of implementing each and everyone of the solutions. Depending on your particular needs and user types, you could select the more adequate tool. Take a look at the SAP Business Intelligence Solutions Comparison Matrix to understand a bit more about each product.

Take the example of Vodafone Turkey, they used Excel to manage their several marketing campaigns in the past, but this process was not only susceptible to human error, but also time-consuming. They needed a functional solution to serve multiple users and help them understand campaigns and act according to their results.

They implemented a central dashboard, a highly visual solution that could accommodate a large number of campaigns and variety of KPIs for both new and recurring campaigns. The Campaign Analytics Solution allows the team to analyze existing campaigns and design outlines for new ones based on key success factors. The dashboard also helps the team to understand the net take rate for each campaign compared to the targeted subscribers. And more significantly, marketers can now easily and definitively follow the revenue generated by each campaign.

If you wish to know how SAP Business Intelligence Solutions can help solve your company´s specific needs, contact us on info@clariba.com or leave a comment below.

Data Quality - the basis for good BI

Usually companies learn about the importance of data quality management in the worst possible way – by dealing with the issues generated by the lack of it, and addressing data errors, data movement, and unstructured data after many costly problems. If your data is lacking in quality, everything you learn from it is useless, as information cannot be trusted. Without accurate customer and performance insight you will never be able to see what areas of your business need to improve. Data Quality Management solutions allow you to integrate, transform, improve and deliver trusted data that supports critical business processes and enables sound decisions. As you expand into new markets or develop new products this will become even more important, as the more data you gather, the easier it is for problems to start occurring.

With SAP Data Services you can enjoy a single solution that encompasses data integration, data quality, data profiling, and text analysis. This will allow you to deliver trusted data that supports critical business processes and enables sound decisions.

To give you an example of the importance of data management, Vodafone Netherlands sought the help of Clariba to implement key reports within a maintainable BI solution while automating report generation and distribution and also to develop a dashboard with key indicators for management. However, the first phase of this project focused on ensuring that trusted data was provided from the current databases to the BI solution. Complex queries were streamlined and redundant data sources consolidated. Subsequently BusinessObjects universes were developed for the central data warehouse and the CDR data mart. Only when the relevant data sources were available, with good quality data, the Clariba team went on to develop the reports and dashboard.

Learn how SAP Analytics Solutions can help your company with its data quality management, making quality your goal. Contact us on info@clariba.com or leave a comment below.