""

SAP BusinessObjects

SAP Universe Designer Tricks and Tips: Table Mapping

You know everything there possibly is to know about SAP Universe Designer right? Well, I bet that there´s still a trick or two you can discover. For example, there is one function not frequently used in Universe Designer called Table Mapping. This option was originally included in Universe Designer to protect some data to be seen by Developers (the developers´ user group sees the data from a different table than the Business users).

In this article we are going to show how to implement this table mapping feature for the use that it was meant for and we will then apply it in a couple of real life scenarios to provide developers with a simple and effective solution that minimizes the maintenance on their systems.

In order to create a replacement rule, follow the steps below

1. Go to Tools – Manage Security – Manage Access Restriction.

Picture1
Picture1

2. Click New to create the new restriction

Picture2
Picture2

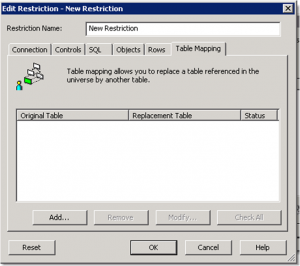
3. Go to Table Mapping and click Add to create the new rule

Picture3
Picture3

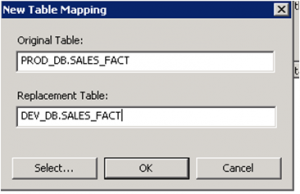
4. Fill in the tables you want to replace. In this case, we want the developers to see the data from the table SALES_FACT of the schema DEV_DB instead of PROD_DB (where we are storing the production data).

Picture4
Picture4

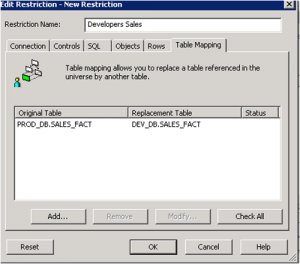
5. Click ok, fill in the name for the rule (In this case Developers Sales) and click ok

Picture5
Picture5

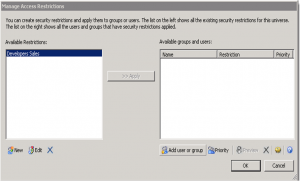
6. To apply this rule only to the user group “Developers”, click on “Add user and group”

Picture6
Picture6

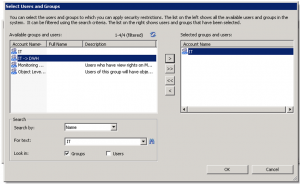
7. Select the group IT, and click Ok

Picture7
Picture7

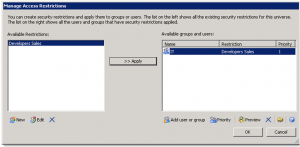
8. Apply the rule to the IT group

Picture8
Picture8

Once we have published the universe, all the reports will change the SQL code automatically between the tables DEV_DB.SALES_FACT and PROD_DB.SALES_FACT depending on the user that is logged into the system.

One important point to take into consideration is the priority of the rules: In case of conflict, the restriction with the highest priority – lowest priority index –  lowest priority number will apply.

The example we reviewed above (dynamic change between developers and business user tables) is the most typical use for this functionality. However, there are some other scenarios where the table replacement could be very useful:

Scenario 1: We are reloading data on a production table. Previously, we have created a copy of the old data in a temporary table that we want to use for reporting while the reloading has not finished.

Solution: We can add a new rule to replace the original table for the temporary one, and apply it to the group “Everyone”. As soon as the reload is completed we can delete the rule. This process is much faster than renaming the table on the universe and to change all the objects that the universe is using on this table.

Scenario 2: We have different fact tables for different departments with the same or similar table structure and  all the dimension tables are common. We are looking for the best solution that reduces future maintenance.

Solution: Instead of creating different copies of the same universe by changing the fact table, we can create one universe and use the table replacement functionality to dynamically switch the fact table depending on the user functional group (in this case would be the department) that the user belongs to.

As we have seen in these examples this table mapping feature provides the developers with simplicity, effectiveness and maintenance reduction on their systems.

If you have any questions do not hesitate to leave a comment below.

Xcelsius in BI on Demand (BIOD)

In this blog article I am going to talk about Xcelsius in SAP BI On Demand (BIOD). What I am going to explain are the steps that you should follow to upload an existing Xcelsius Dashboard to the BIOD system. 

What is BIOD?

First of all, for those who don’t know what is BIOD I will give a brief explanation. Basically we can say that BIOD is the most complete and approachable cloud based business intelligence suite available in the market today. BIOD is software as a service; you do not need to install any software on your machines to get instant value from the system. All you need to do is Log in and provide some data. It is a cheap BI solution, due to the fact that you don’t need to make a huge investment in hardware, licenses, etc... everything is in the net.  The target for this technology is small companies, which are less likely to be able to acquire a BI system due to the costs, but with BIOD they have an accesible  way into SAP BusinessObjects analysis system. In BIOD you are able to create:

  • Xcelisus Dashboards
  • Web Intelligente reports
  • Explorer

You can get more information about BI On Demand here.

 Now, let´s see how to upload an existing XCelsius Dashboard to the BIOD system.

How to upload an Xcelsius Dashboard to BIOD?

First of all, if you don’t have a BIOD account you should create it. It s free, and with it you will able to test most of the features of this cloud system. Click here to Sign up.

Once we are logged, we will see this screen.

Now I want to show you how you should upload an existing Xcelsius file with static data to the BIOD system.

First of all we should create the DataSource, so in my Stuff panel we should select Datasets. After that we click Add New Button  -> Add Dataset

Then we should chose from which place we will select the dataset. We have several options: Create From Query (this option is only available in the BIOD Advanced version, where the connection to a universe is possible), bring data from salesforce or create an empty dataset from scratch and finally, we can upload a file (xls,xlsx or csv) which we will use in this example.

As I said before, we select an excel file as source of our dataset, in the first row of our excel file it is important to have the labels of each column. We can also edit this dataset, change the value type of each column, the label name, etc...

At the bottom of this page we can find the properties section, here we should enable the Web service. Once we have done this, the system will generate a url that will be the reference to the dataset in our dashboard.

The next step will be to upload the Xcelsius file as a template, so we select Add New -> Add Template.

We create a name for this template, uncheck the Create a new Xcelsius file check box and finally, select the xlf file that we have locally.

The screen below will then appear. In order to connect the dataset to our xlf file we should select the blue sentence (you may click here to edit the Xcelsius file). You can also attach an image of the dashboard as a thumbail for repository. The object selection will be fancier.

Once the Xcelsius editor is opened we add a connection using OnDemand -> Add Connection menu option. This will create one Flash Variables connection ([Flashvar]) and two Web Service Connections ([OD_Data1 and OD_Data2). In our case we should delete one data connection because we only have one source, but in case we need more data sources we can create as many as we want. It will also create a new tab in the XC spreadsheet that contains these cell bindings.

After that we configure the data connections. Open the Data Manager (Data -> Connections) and you will see a Connection of type FlashVars.  You should see the following:

  • get_data_url: (mandatory). This should be bound to the cell which the Web Service Url of the Web Service Connections are also bound to. If you have multiple connections this should be bound to the range which holds those connections.

Then each Web Service Connection (OD_DataN), in our case only OD_Data1 points to the set of cells to which that connection outputs its data.

These are the next steps that you should follow in order to setup the dashboard:

  • Click on My Datasets and click copy beside the dataset OD_Data1.
  • Paste the url from dataset to the WSDL URL input box of a Web Service connection

  • Click Import to import the schema.
  • Bind the web service url to the same cell as get data url (Note: if you used the Add Connection process this should already be done).
  • Bind the headers and the row values.
  • Set Refresh on Load to be true.

After these steps you can save your changes and then click the Back button to go back to Edit Connection step of creating a template. You should see your connection listed on the screen.

Click Next to go to the Edit Sample Data step, you can choose to add in your sample data from the XLF if you like, and then click Finish.

Finally we will create a visualization using this template. We select our Data Input, in this case Data Source.


If we go to the visualization menu we can find the object.


In conclusion we can say that the BIOD system is a nice tool to start testing the power of the SAP solutions without a potential heavy investment at the beginning. It can be also a good tool to make demos on and show our dashboards to customers. It is very interesting to test the explorer tool, you can see the amount of options that the BIOD brings you in terms of data analysis.  If you are interested in the advanced solution you should get in touch with SAP.

If you have any comment or doubts do not hesitate to contact us or leave a comment below.

Tackling the Aggregate Awareness Dilemma

In my last project I faced a situation where the customer asked me about the best option for a particular topic and this time my answer had to be "it depends". As a consultant, my duty was to provide two different options (with their corresponding pros and cons) but I could not make a decision on this, since the answer was highly dependent on the composition of IT service providers in different areas and also their road map. In general BI terms, we could define aggregation as the process of summarizing information at a certain level of detail in order to improve the performance. The Kimball Group defines Aggregate Navigation as the ability to use the right aggregated information and recommends to design an architecture with services that hide this complexity from the end user. In the BusinessObjects world the same concept is called Aggregate Awareness and the database administrators community usually refers to it as query re-write.

In SAP BusinessObjects, this can be achieved through the use of the function @aggregate_aware, contexts and incompatible objects in universe designer. At a database level (RDBMS), certain vendors provide this feature through Materialized Views with query re-write option (Oracle, Sybase, DB2, Informix, PostgreSQL and some others).

So here we have the dilemma: where to place this logic in a customer environment: in the physical layer or in the logical layer?

Both options are valid, but there are some considerations that need to be taken into account from different points of view:

Table Comparison

The information seen in the table above can already be interpreted, but as a summary, my recommendation would be:

Implementing Aggregate Awareness in SAP Business Objects:

  • Ideal for an architecture with many database sources (not all database sources support the query re-write feature and it needs to be maintained in each of them)
  • Good to have if the database vendor may be changed in the future (no changes needed in the universe)
  • No access to strong Database Administrators that can properly tune the database
  • Closed reporting architecture relying on a strong semantic layer in Business Objects
  • There is a need for a centralized metadata repository

Implementing query re-write mechanisms in the RDBMS:

  • Ideal for an architecture with many reporting tools accessing the same database
  • Access to strong Database Administrators
  • It simplifies universe design
  • There is no need for a centralized data repository

If after reading this post you still have doubts on what direction to go for at your company or customer, do not hesitate to contact clariba at info@clariba.com or leave a comment below.

SAP BusinessObjects Explorer 3.2: Creating Row-Level Security

In the past few months I had the chance to implement a solution based on the combination of SAP BusinessObjects Explorer and mobile devices. The challenge was: “I want to explore the same information that I see on my dashboards with SAP BusinessObjects Explorer on my iPad. In this particular case, some of the customer`s dashboards were really complex and we had to deal with many issues. Today I would like to share with you how we solved one of these issues:

How to implement row-level security into a space of Explorer?

The solution to this challenge cannot be based in any case of security implemented at universe level, in SAP BO Explorer the information of the spaces is retrieved when we index the space, this means that any kind of security applied at universe level will have a direct impact when we index the space. What we needed was a space with all the information but able to be filtered on demand based in some personalization rules.

With SAP BO Explorer 3.2 we are able to generate and apply this kind of security by creating two spaces: one reference space with all the possible information to explore and one personalized, where we will be able to filter the information displayed on demand based on the rules of personalization and making use of the reference space.

Definition of the scenario

To be able to follow the implementation of the solution, assume that we start from:

  • SAP BusinessObjects XI 3.1 installed and fully operational
  • SAP BusinessObjects Explorer 3.2 installed and fully operational

To make it easy to follow I will make use of the eFashion universe and we will need to create users in BO according with the list of values of Name of Manager dimension (Store -> Store Details->Name of manager).Note that the name of the users should be exactly the same as the values of the dimension.

We will create a new space based on the eFashion universe information. The personalization rule is that the Store managers will have access to the space but they will only be able to see the information related to their Store(s).

Creating the e-Fashion Reference space

First open SAP BO Explorer and login with administrator credentials. Click in Manage Spaces, select e-Fashion Universe and press New

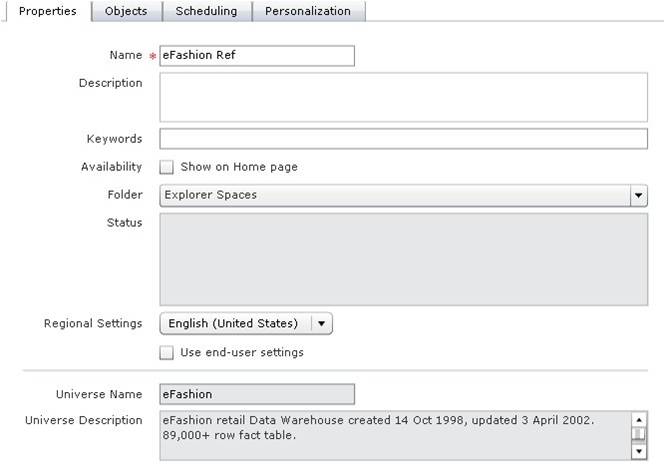
In the tab Properties introduce a Name, in our case eFashion Ref, and select a folder under Public Folders, for the example Public Folders -> Explorer Spaces

The users should not be able to access this space, so remember to uncheck the option Show on Home Page

In the tab Objects select the objects that we will use in the space, in the example this tab will look like this

Then click Validate the space and then OK to save the space

Now you will have to Index the space, to do this just press the Index buttonOnce the status check shows the following symbol the space is successfully indexed.

Creating e-Fashion Personalized Space

Now we will implement the space to be accessed by the users, in this space we will make use of the eFashion Reference space created before to build a space with the personalization rules defined.

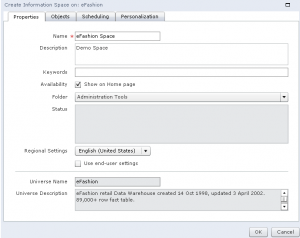
Log in with Administration rights into SAP BO Explorer, go to Manage Spaces, select the eFashion universe and press New. In the tab Properties introduce a Name, in our case eFashion Pers, and select a folder under Public Folder, for the example Public Folder -> Explorer Spaces

Select the same objects that we have used to create the eFashion Ref space

Go to tab Personalization, check Personalize information space Exploration and Select the eFashion Ref space from the list Select an information space

Now select User, from the table To Filter, and select Name of the Manager in the drop-down list in the column Filtered By.

We will link the rest of the dimensions of the personalized space with their corresponding ones on the reference space. The Personalization tab should finally look like this:

Validate the space and press Ok to save it and Index the new space eFashion Pers

Security Topics

Before testing the solution, and to avoid strange behaviors of the SAP BO Explorer spaces, we will have to review the security applied to the different components involved in SAP BusinessObjects. To “make our lives easier” I suggest creating a User Group (i.e. Explorer Users) in SAP BO and I strongly recommend reviewing this list of topics to ensure that the group has:

  • Granted access to Explorer application
  • Granted access to the Universe
  • Granted access to the Connection used on the universe
  • Granted access to the folder where the spaces will be stored.

In this example, what I did was to grant View On Demand access to all of the items of the list.

Finally the solution is ready to test!

Testing the solution

Log on in SAP BO Explorer with one of the users we have created, i.e. Quinn, from the Home tab we will access the eFashion Pers space and see only the data belonging to manager Quinn

If you log on with another user created, i.e. Steve, from the Home tab we will access the eFashion Pers space and see only the data that belongs to Steve

I hope you found this article interesting. For any queries regarding the contents of this article please leave a comment and I will readily reply.

SAP BusinessObjects Mobility Solutions (Part 1 - SAP Explorer)

As you might have already noticed we live in a mobile world. The increasing use of mobile devices for everyday tasks has become a common place in the course of the last decade. Business Intelligence has not fallen behind on this trend. On this series of two blog posts on SAP Business Objects Mobility Solutions, we will analyze mobile applications that SAP Business Objects has made available to bring BI to mobile devices (more specifically the Ipad): SAP Explorer and SAP BI Mobile.

Through this analysis we will learn what is the process to install the applications and review a few important things we need to consider. We will focus only on their mobility piece (Explorer for example can also be accessed on non-mobile devices) and we will also review some details of server side installation for each tool.

Both of these tools can be downloaded through SAP Marketplace (if you are an SAP partner).

If you are not an SAP partner but still feel like trying out these tools you can download the mobile applications from the app store and try out the demo servers SAP has made available.

First off, let us give you some details on our test environment and the software that was installed in it.

Software:

Business Objects XI 3.1 SP3 Enterprise

  • SQL Server 2005

  • SAP Explorer 3.2

  • BI Mobile 3.1 SP4

Hardware (Virtual Machine):

  • Windows Server 2003

  • 4GB RAM

  • 2 processors

  • 30 GB hard drive

With the above setup ready let’s start with our first Mobile tool from SAP Business Objects.

SAP Explorer

This is the first SAP tool based on in-memory technology. It is aimed for casual users who require an agile and pre-built framework for reporting but that still allows them to filter and search data intuitively. It was initially released as a web application only but the mentioned characteristics make it an obvious candidate for mobile devices, so the mobile application came out shortly after.

Once you have the installer files downloaded from SAP Marketplace it is time to install it on our Business Objects environment.

Installation

The installation of SAP Explorer is pretty straightforward. You will find that there are very few screens that we need to pay full attention to and these are the ones we will focus on during this post.

You would install the application and web server components together or separated, depending on your system configuration. In our example we will install the whole product on a single machine.

For environments where the web server is not located on the same machine you will have to install independently the Web Application Server Component in the list above. However, it is also possible to install, for example, the indexing server on a separate machine to optimize efficiency. The index server is the one in charge of generating the space and might require a heavy load of processing power depending on your configuration.

Administrator credentials will be required during installation, so make sure you have them handy, as well as CMS name and port.

Finally the node name will be requested. This is used to identify the installation in multiple/parallel Explorer setup. For example, to link an isolated indexing server to its Master server. In our case we will leave the node name with the default name (which on this case is the computer name) as all of our installation resides on the same place.

Once the installation is complete we can test it by accessing the following url: http://yourserver:8080/polestar

If everything is setup correctly you will see the login screen for Explorer.

NOTE: If you would like to review the installation process in more detail it is best to review the Installation Guide also available in the SAP Marketplace.

Creating and Configuring a Space

Next step is to create a space.  The space is the indexed data that Explorer builds based on a Universe or File. To build it we will need to do the following:

  • Login to SAP explorer

  • Click on the Manage Spaces option

  • Select a universe

  • Select New

Provide the necessary information to build the space. We will need to provide at least:

  • Space name

  • Storage location

  • The dimensions and facts that will be computed on the space

Once the space has been configured we now need to index it. This process can be executed on demand or it can be scheduled, as a one time only or recurrent event. Depending on the size of the data selected from your universe this process might take from minutes to hours, so be aware of this before long running queries are configured to build a space. Once the space has finished indexing its data it will be marked with a green check.

Now we can plugin our mobile device to the space!

The Mobile Application

Before we plugin your device, first we need to download the application from the app store. We will find it under the name "SAP Explorer".

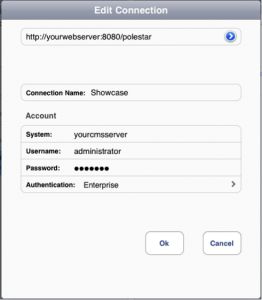
Once downloaded we need to configure a new connection with the following details:

  • Connection Name

  • CMS System name

  • Username (with permissions to use Explorer)

  • Password

  • Type of Authentication

There are no complex requirements on this configuration screen. Just make sure you provide the correct data for each component (web server, cms, cms port, etc).

NOTE: the official SAP Explorer Mobile installation guide specifies that installing SAP BI Mobile servers is a requirement. In reality, this is only optional and by installing SAP Explorer server you should be able to access Explorer with your mobile device.

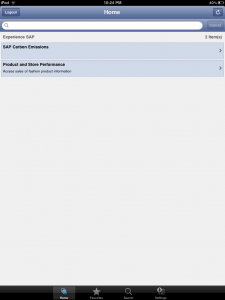
You should now be able to start the connection to the Explorer server and work with the space created before. On this example we will use the SAP Experience connection that comes configured by default on the Ipad application.

If the connection is successful you should find the following screen listing all available spaces:

Once a space is selected from the list we would face a screen that looks pretty similar to what you have seen in the web version of Explorer.

The mobile version of SAP Explorer has no differences on functionalities against is Web-based version and only minor changes have been done to adapt for touch interaction on the Ipad.

As you have seen, installing and preparing SAP Explorer Mobile is a no-brainer.  Run through the installation process and you are setup to start using spaces and in-memory analysis on the Ipad.

As of now there are no other apps released by SAP for other mobile platforms (i.e. Android). Some might say this is not necessary due to other platforms support of flash technology, but the responsiveness of the Ipad application definitely sets this version appart. We hope to see dedicate applications to come out for other mobile devices soon.

The next mobile application - SAP BI Mobile - will be covered in the next article of the series, that should be out in early January.

If you are interested or have worked with this application, or if you feel it might be useful in your organization, please leave a comment below.

StreamWork – the Collaborative Work Environment from SAP

We are noticing that our customers and potential customers are starting to look for collaborative models and workflows. The reason is that they want to foster and improve teamwork and reduce human errors by creating approval flows for their internal tasks. So, if yesterday the power users or IT could directly modify the values of a database without any control, today, with an increasing number of employees and a growing level of complexity for processes, they prefer formal workflows to drive efficiency and always ensure the approval of the management, a collaborative model that can reduce or even eliminate errors coming from lack of control on actions.

SAP does not yet have any workflow engine (or at least we are not aware of it), but we have what SAP calls “Social Intelligence” tool, which is called StreamWork.

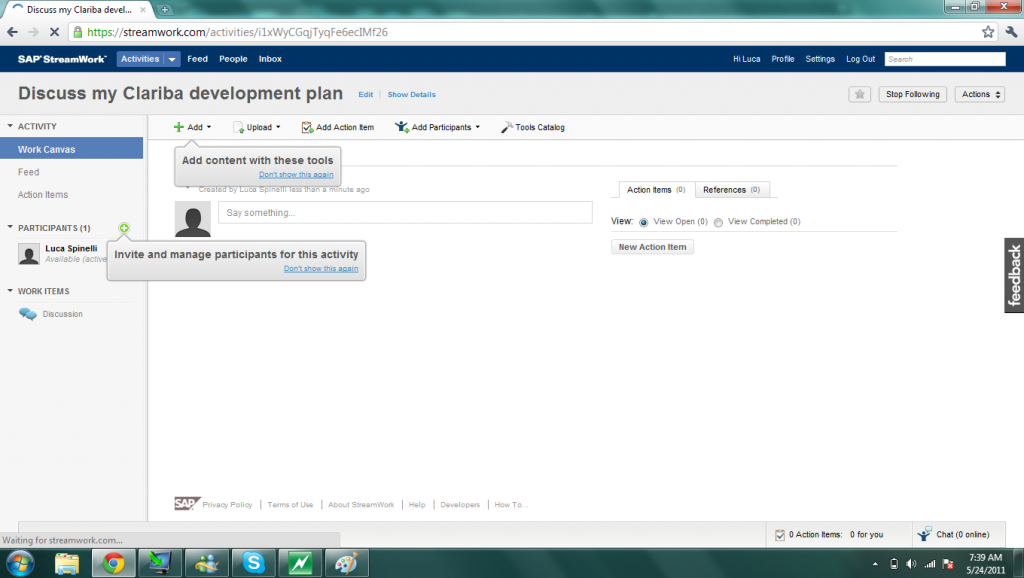
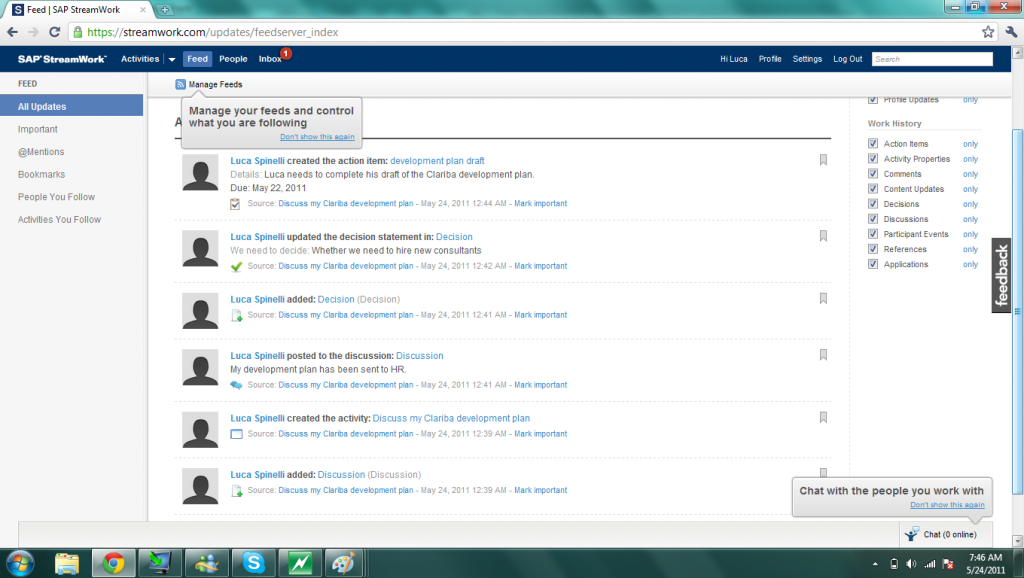
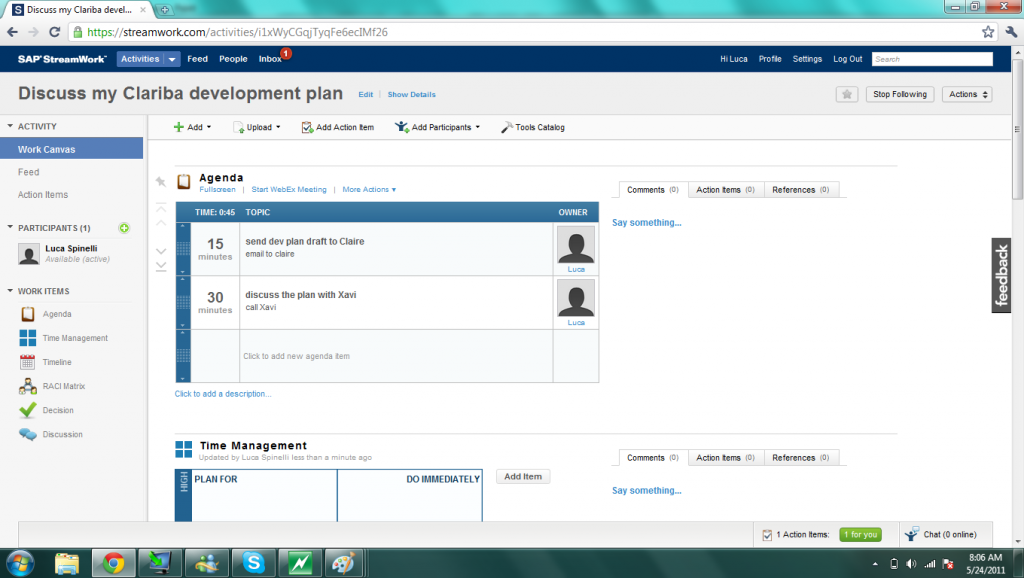
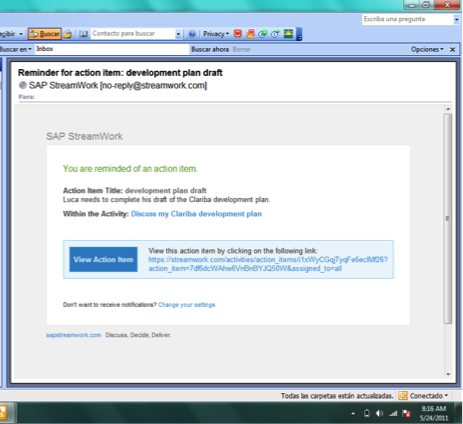
This solution looks like a mix between Facebook, Twitter, LinkedIn and MS Outlook/Projects. I have taken some print screen images during the tests I have done in one of our clients, so you can see what is available:


Users can create tasks/activities and add participants;


Add actions to different tasks;


Manage feeds and control what they are following;


Set agendas and RACI matrices;


Define notification settings and get email reminders on their inbox…


…in a few words: they can collaborate while they work on a project.

If you want to access a free version of StreamWork, please go to www.streamwork.com and sign in. Moreover, you can find a white paper attached sap_streamwork, where you can read what SAP says about it. In my opinion, a very interesting tool, worth checking it out.

How to search faster and more efficiently with Firefox (and Chrome/Opera)

Implementing technologies in environments that are always changing often generates doubts and challenges for us consultants. Of course you can ask your colleagues, but they are not always free and sometimes they just don't know the answer.  So most of the time we are relying on the Internet to find tutorials or people who met the same problems before and explain how they have solved them. Therefore being able to search fast and efficiently makes our lives easier. Fortunately, some of the modern browsers (who said IE6?) give us this possibility. I will now give three main tips to improve the way you search the internet - if you don't have much time, jump directly to the 3rd tip, which is the most effective one.

This article focuses on Firefox, but alternative browsers are mentioned as well.

Tip n°1: add search engines to your browser (Firefox, Internet Explorer, Chrome, Opera and Safari).

On Firefox you can see the search engine box on the top-right corner of your window.

If you click on the symbol on the left (here the Google icon), you will see a list of all the search engines you have already installed, plus an option to manage search engines. One of the best options available to look for new search engines (at least for Firefox, IE and Chrome) is the Mycroft project: http://mycroft.mozdev.org/

For example, if we search what are the search engines corresponding to SAP, then we find (unter section 6. Computer) the following:

Just click on one of them, and confirm that you want to use it as a new search engine.

You can now do searches based on this search engine.

Tip n°2: assign keywords to your search engines (Firefox, Chrome and Opera).

Assigning keywords to your search engines is quite easy. Open the "Manage Search Engine List" window, select the search engine of your choice, click on "Edit Keyword..." and just enter a keyword - and it is better if you make it short, for example "g" for Google and "w" for Wikipedia.

Once you've done this, you do not need to manually select the search engine anymore! Go to the address bar (remember the Ctrl+L shortcut), and simply type the keyword for the chosen search engine, followed by the searched term. Example: "g rapid mart" if you want to look for rapid marts on Google, or "w SAP" if you want to look at the SAP Wikipedia page.

Tip n°3: use bookmarks with the %s variable (Firefox, Chrome and Opera)

The search engines feature has many advantages, but also some clear limitations.

The most obvious is that not every website has an associated search engine, like for example the very useful Business Objects Board.

The second limitation is due to the nature of search engines - they're rather browser-specific, and the process of backing them up / restoring them is not always straightforward.

Fortunately, there is an even better solution which combines all the advantages of the search engines with the flexibility of the bookmarks. The solution simply consists in using "%s" in the URL of a bookmark.

Let's take a simple example: you are often using the excellent WordReference.com to translate from English to Italian and backwards. If you open the website, type the word "printer", choose "English-Italian" and press Enter, you get on the page "http://www.wordreference.com/enit/printer". Now create a new bookmark, but replace the "printer" in the URL with "%s". You end up having a new URL "http://www.wordreference.com/enit/%s". Assign a keyword to this bookmark - for example en_it. Now if you type "en_it printer" in your address bar (once again remember Ctrl+L), you are taken to the same page.

The huge advantage of bookmarks is that they can be synchronized rather easily, be it with Firefox Sync or Xmarks.

Here is a list of some of the bookmarks I use almost every day, with URL and possible keyword. Don't hesitate on using them!

  • Acronym Finder (acro) http://www.acronymfinder.com/~/search/af.aspx?pid=osearch&string=exact&acronym=%s

  • Business Objects Board (bob) http://www.google.com/search?name=f&hl=en&q=site%3Ahttp%3A%2F%2Fforumtopics.com%2Fbusobj%2F%20%s

  • Cambridge Britsh English Dictionary (dicoen) http://dictionary.cambridge.org/search/british/?q=%s

  • Google Images (img) http://www.google.com/search?hl=en&q=%s&um=1&ie=UTF-8&tbm=isch&source=og&sa=N&tab=wi

  • Google Maps (maps) http://maps.google.com/maps?q=%s

  • Google US (ge) http://www.google.com/search?name=f&hl=en&q=%s

  • Google France (gf) http://www.google.fr/search?q=%s

  • Wikipedia English (we) http://en.wikipedia.org/?search=%s

  • Wikipedia French (wf) http://fr.wikipedia.org/?search=%s

  • SAP Notes (sapnote) https://service.sap.com/sap/support/notes/%s?nlang=E

If you have any further tips, or if you feel a useful bookmark is missing from my list, share it with us on a comment below!

SAP Strategy Management: When the Customization Generates New Standards

During the time we spent at our customer in Abu Dhabi, we learned a lot about the SSM customization until we realized that the final product could be a new standard instead of a customization. Our customer had some concerns about the out-of-the-box features and they were asking us to modify the functionality by adding new ones and automating the entire platform.

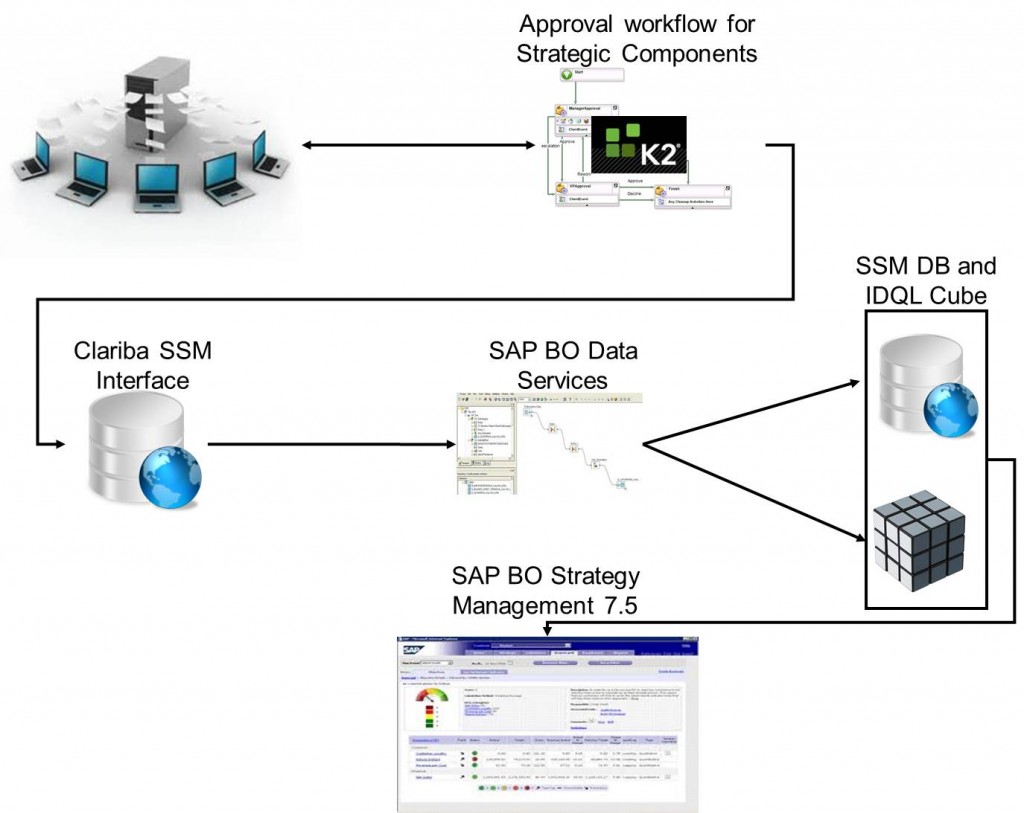
The biggest challenge we had was related to the approval work flow. How can the customer approve the creation of a new Strategic Objective? SSM does not allow the user to perform this task and our customer raised this topic as a risk. The work flow for the strategic components became a requirement from that moment. They asked us to use K2 black pearl, which for us was like a black box. We decided then to merge our teams and split the work in order to achieve the same goal.

We created a simplified SSM data model that reduced the number of tables needed to create a Balanced Scorecard and we connected it to SSM. From our interface we were able to populate any strategic components as well as the cube (using IDQL commands). We then created the database and a dedicated ETL (with SAP BO Data Services) that was populating the balanced scorecards.

On the other side of the desk, our customer was building the work flow in K2, creating the new web pages that are now replacing the SSM administration tool and connecting the output directly to our interface tables.

It took us a while before we got a chance to see something that was really working, but we did it; we built a powerful interface that creates balanced scorecards within SAP SSM.

In this interface everything runs automatically, the KPIs as well as the perspectives, the objectives, the initiatives and also the milestones are being updated by a scheduled ETL job in SAP BusinessObjects Data Services.

The customization we made can be summarized as follows:

  • Normalization and re-engineering of SSM tables (after performing a specific analysis on SSM data model) to create our interface DB.
  • Connection of our interface tables to the SSM tables.
  • Customization of the standard IDQL jobs that are updating the SSM Cubes.
  • Making SSM read-only to avoid changes on initiatives or milestones from the end user interface.
  • Making the SSM interface tables available for reporting and dashboarding as they can be included in a simple universe.

So far the only manual intervention that the customer needs to do is create the strategy maps. This step needs to be done from the SSM administration tool.


To conclude, the solution we explained above has been created as a customization but it can be adapted for any customer that might need this level of security and detail for their SSM implementation.

Part of this implementation could be applied for the companies that need to have an automated KPIs basket that does not includes any manual entry for the values (the final part of this solution can be considered as an SSM DB connector). This solution has been developed by using SQL Server 2008 but it can be connected to any data sources (i.e. SAP R/3, ORACLE DB, flat files, etc.).

If you think that this solution might work also for your company or your customers please feel free to contact us by email at info@clariba.com or by leaving a comment below.

How to move content in BusinessObjects BI 4.0 with version control using LCM

In SAP BusinessObjects BI4, SAP provides us with an enhanced LifeCycle Management (LCM) application to deploy content.  This version has new features useful for moving our files between servers or directly between BusinessObjects XI repositories. The enhancements include aspects like security, the capacity to recover different document versions, the ability to safeguard information and provide internal control about what changes are made and who has made them.

It is also important to note that with the release of BI4, the Import Wizard (the tool used up to this release) is no longer working for deploying content between two BI4 servers; it only works to upgrade from a previous release.

One of the most important new features of LifeCycle Management is that you can import categories as well as other types of objects such as: Information Designer, Pioneer, Crystal Reports (next generation), Events and Xcelcius Enterprise.

Another improvement is the new exportable file version: LCMBIAR, which contains an enhanced file structure adapted to these new features. The Job component allows us to define a set of objects to transfer in LCMBIAR format. We can group these Jobs in folders to keep content organized into departments. However if the two servers are in the same network, the files  can also be migrated directly from one platform to another.

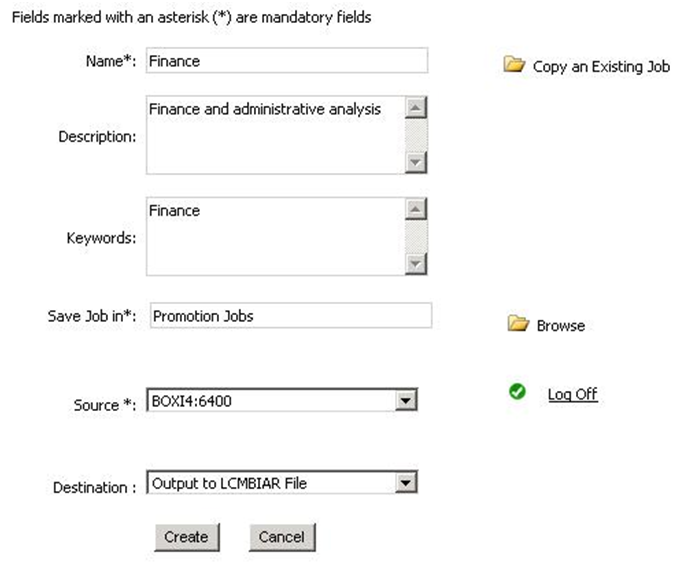
To create a new Job you will need to define: name, folder, origin and destination. Optionally but recommended you can add description and keyword.

LCM Menu
LCM Menu

In the Job you can select the objects that will be included in the LCMBIAR files, then click on ‘Manage dependencies’ to add items related to the objects selected before. Finally, you need to click ‘Promote’ to configure the Job settings.

Promote Panel

In the Promote panel we can find four options:

  • Summary: Check source and destination names to ensure the file is moving from the right source to the correct destination, change management ID.
  • Security Settings: Check this option when you want to release the security of the files.
  • Test Promote: Use this option to ensure that there will not be errors during the conversion.
  • Schedule Job: This is to plan the promotion task for later, very useful if you are not available to do it manually, typically at out of office times.

Rollback

The new feature Rollback deserves a special mention. It allows us to check the different versions of a conversion set and, in case of errors, to revert back to a previous stable version and therefore prevent any risk to the project.

Before starting a Rollback, you must ensure that the status of the job is one of the following:

  • Success
  • Failure
  • Partial success

The Job status refers to the current version in the system.

You can access the Job History from the home page after login to LCM. The Job History shows the list of all the previous versions of the selected Job. Please note that you only can go back to the most recent previous instance.

To restore the latest instance, click in the check box and then press Rollback button.

You can choose between two rollback options:

  • Complete Rollback: this will restore the destination system to its previous state before the job was promoted
  • Partial Rollback: enables you to roll back a set of infoobjects included in a job by selecting them from their objects list.

In summary, the handy Rollback function sets the latest instance as the current system version and enables the previous instance for rollback if required.

Conclusion

To summarize, the enhanced LifeCycle Management application is the best option to release your documents from development to production in SAP BusinessObjects BI 4.0. If you have questions about this method, or if you want to share your experience or tips, please feel free to leave a comment!

Dynamic Scale in WebI for Combined Graphs

The scale in graphs for WebI is something that can be left as automatic or it can be hardcoded by introducing figures. However it is always preferable to select the automatic set up for the following two reasons: firstly because when a new value is added to the graph, it won’t  out of scale, and secondly if the graph is located inside a section, the user will always enjoy the optimal graph size. But automatic scale has an issue when dealing with combined graphs. For example, if what we want to compare from the Y and Z Axis needs to be in the same scale, WebI creates two different scales. To help you with this challenge, this article will show you a workaround so you can have identical scales for all graph Axes, preserving the native dynamic feature of the scale.

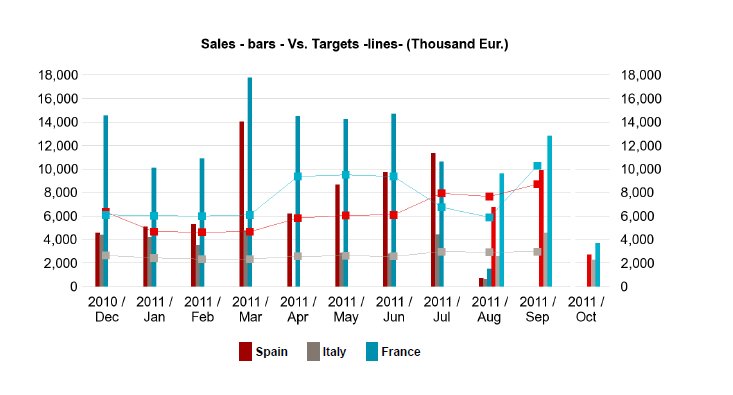
The Workaround Let's imagine the example of a combined graph with bars and lines. And imagine that your sales department wants to see the sales in bars and the target in lines, in a monthly evolution. The chance that the bars and lines will have the same scale is low, because targets normally are higher than the sales. As a result users cannot compare both pieces of information, even if they are shown in the same units.

A workaround to get to see target and sales in the same scale is the following:

  1. Create a measure with the highest value by month of the sales
  2. Create a measure with the highest value by month of the targets
  3. Calculate the maximum value between the two of them
  4. Allocate this dummy value in the last month shown of the graph and store it in a new measure
  5. Drag & Drop this last measure in both Axis (Y and Z) and paint the result in the same color as the background, so it is not seen

The Result

The graph will have the following look & feel:

Fig.1. The same optimized scale for both Y and Z axes also applies with Sections

Notice that if we decide to go for grid lines, these ones will have a small defect when it comes to the place where the dummy bar is shown. This is a small price you have to pay for the great functionality achieved, but remove the grid if you prefer and the result will be absolutely professional.

Conclusion This workaround adds value to the user who is looking for two measures being compared graphically and wants to always have the optimal data size automatically. If you have questions about this method, or if you want to share your experience or tips, please feel free to leave a comment!