""

SAP BusinessObjects

SAP HANA Sandbox Implementation for In-house Tests

SAP HANA gets you moving at the speed of light

It is early days, but Clariba is at the forefront here once again with our initial SAP HANA installations. Indeed, SAP HANA is positioning properly in the starting grid of the BI stack for new deployments. That is very good news for all of us who are in the SAP World. However, even though everyone is (theoretically) aware of what SAP HANA is and its main benefits, not so many consultants know what the real options for having that in-house are and therefore they are not able to start making the first tests and getting their hands dirty with the tool. This is really important as we do not usually know when a real SAP HANA project may come up in our portfolio and we want to be ready for that. The main purpose of this blog entry is to shed some light on this topic.As mentioned earlier, surely almost all of our Clariba blog readers already have heard about SAP HANA. For all those who are still late let me pinpoint the primary concepts of it. Basically SAP HANA is a Database Server taking advantage of the SAP In-Memory Computing technology. This technology empowers dramatically the entire business – from shop floor to boardroom – by giving real-time business processes and applications instantaneous access to data, enabling real-time business applications and analytics system.

Back to the point, nowadays we have 2 real options for having our own SAP HANA environment up-and-running in our office. Depending on our budget and our requirements we can go for the cheapest option which is to apply for a virtual instance of HANA in the cloud or the most expensive one which is acquiring an official hardware appliance from one of the leading hardware partners of SAP.

The first and cheapest option is to go for a SAP HANA Application located virtually in the Cloud. This is an on-demand application environment and SAP offers a range of services with that. Nowadays SAP is offering SAP HANA Database environment in Amazon Elastic Compute Cloud (aka Amazon EC2). This is a complete fully working instance which can be accessible through SAP HANA Studio with really nice performance (depending on the requirements the instance may be created with more or less HW resources).

Under this context, before creating our SAP HANA instance there are two prerequisites which have to be met. First thing is to ensure you are a member of the Sap Community Network (SCN) - you can register here. This process is totally free of charge. Second is registering in Amazon Web Services (AWS). You will be requested to use your credit card because although registering is free, the charges will come up as soon as we create our SAP HANA instance. Amazon charges money from that point on. Even when the instance is stopped they will still be charging. Regarding the costs, they can be foreseen in advance using their own pricing calculator which can be found here. Just to give an idea, the smallest instance costs 50$/month with a 25h per week usage. We definitively recommend terminating the instance once the test is completed. The entire process to create the AWS instance can be found here.

The second option is absolutely the best but also the most expensive one. The idea is to purchase an actual brand new SAP HANA rack data base server. Currently SAP is in partnership with Intel, IBM, Fujitsu, Dell, Cisco and HP companies so you can contact directly with them and check their actual prices. They have a nice variety of models in order to meet all customers` needs. It is only with this sort of installation that you will get the best SAP HANA performance. Just to give you an idea of the remarkable speed in one of those machines, our consultants loaded more than 250 Million records in our sandbox system and they were achieving less than 5 seconds of average response time for any query we run against the database. Not bad at all, is it?

Finally, I would like to mention that you might find other options in forums for using a laptop with a fresh SAP HANA installation that involve altering installation code. This solution is not supported by SAP; therefore Clariba strongly discourages you to use it. The 2 options listed above will give you much better performance.

In conclusion, SAP HANA has become a reality in our BI world. As time goes by, our SAP customer datasets are exponentially growing and will eventually exceed the abilities of their commonly used tools. Transition towards SAP HANA will be a must for them, but also for us. Ensure you are ready for that by getting to know the tool. You know what options you have now, so go for it.

If you have any tips or questions, please leave a comment below.

SAP BI Services - Part 1

During the last couple of years I have been part of a team developing quite a few SAB BusinessObjects Dashboards (Xcelsius). In order to develop them, one of the key requirements is to have a consistent data source. Historically we have used all sorts of techniques that SAP BusinessObjects has made available, from QAAWS to Live Office. Each method has its pros and cons and there are situations on which using one over another makes sense.

On this article I will focus on the last method I have discovered: BI Services.

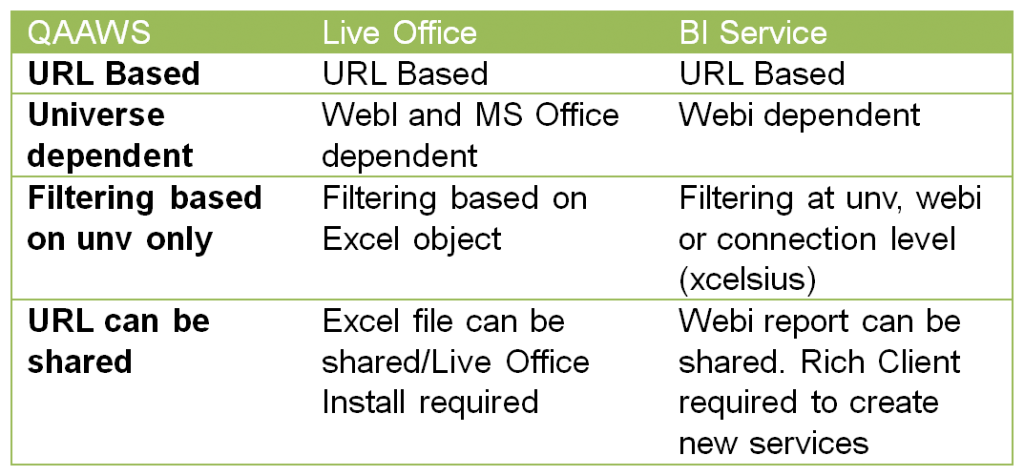
Comparing the three methods most frequently used, the following table shows their common characteristics as well as differences:

The main advantages I see on using the BI services method are:

  • Using W as an aggregation engine
  • Robust Query/Block organization
  • Enterprise re-usability
  • Filter capabilities at SAP BusinessObjects Dashboards (Xcelsius) connector level
  • Additional Metadata
  • Performance increase by using Webi servers engine/cache


Basic Requirements

Now let’s talk about how we can implement this solution in our Business environment.

As indicated above the BI Service is dependent on a WebI document. This means that it gets its data from a WebI report block. Also note that it is only possible to use this functionality if you have the WebI Rich Client application installed and you have enterprise permissions on the application. For our particular example we are using a client tools installation with version 3.1 SP 2.4.

Configuring the BI Service CMS Server

If you meet the two above requirements then let’s go ahead an open the WebI report that contains the block that will serve as the data source for our BI service.

Once the report is open you will see the on the top right of the WebI Rich client application.

We need to mark the check box to display the BI Services panel. The following panel will appear on the right side of the application:


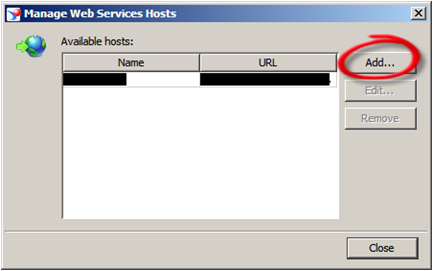
Now we need to configure the CMS server we will be accessing by clicking on the manage servers button.


Click on Add and enter the details corresponding to your SAP BusinessObjects system. The data input parameters are: CMS name and dsws URL (which should be something like this http://yourserver:port/dsws)


Once the server has been configured, select it from the list and click on the refresh button so all BI Web Services available are displayed.


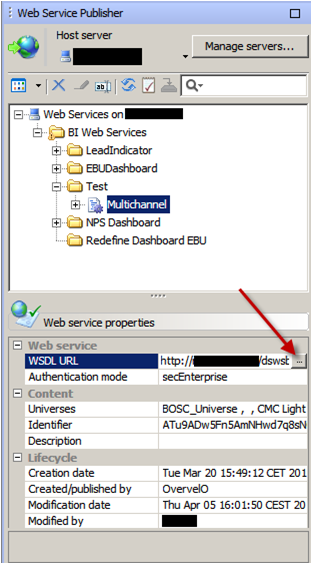
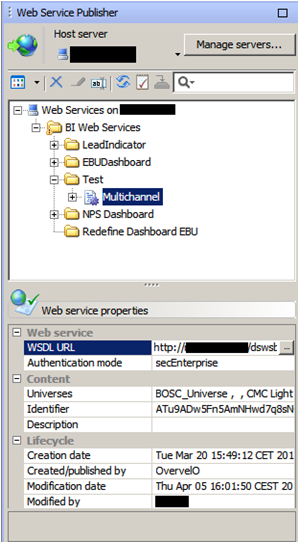
A list of BI Web Services will appear if any exist in the system. The BI Web Services can be organized in folders and each BI Web Services can have 1 or more blocks of data. We will talk more about these organization structures later on this blog.


You can see the 3 levels of organization in the screenshot below:


In order to consume from one of the BI Services available you will need to use the WSDL url which is one of the properties that appear when you select the block you wish to consume from the list.

Click on the three dots button on the right so you can see the BI Service definition.


The BI service description should look similar to the screenshot below.

NOTE: If you can’t see a page similar to the  one below, then the BI service URL is not accessible from the machine you are querying from and that might cause trouble later on. 

Click on the wsdl link.


Creating a new BI Service

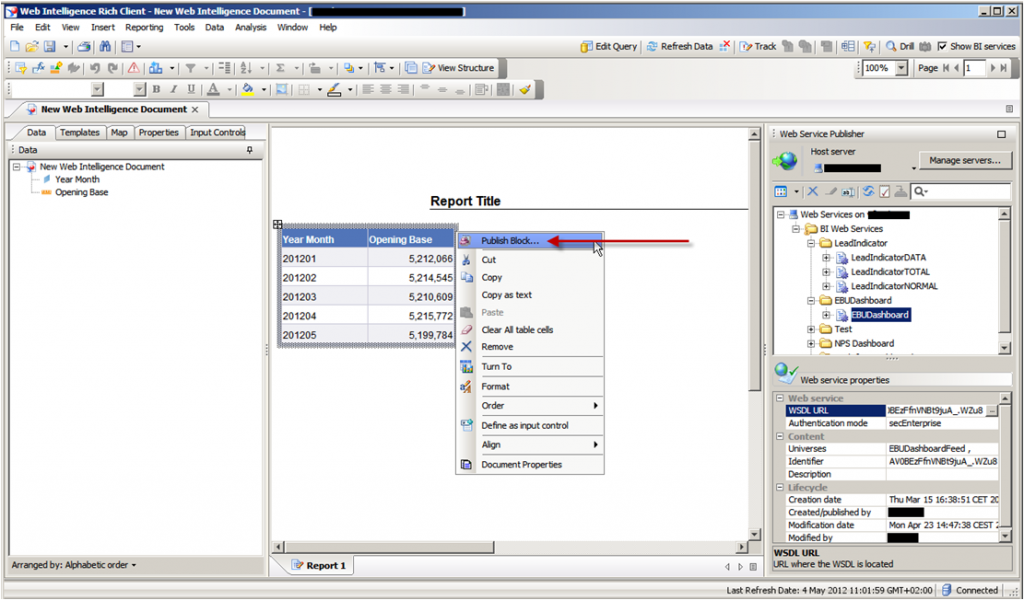
Select the block from the WebI report and right click on it. A context menu will appear with its first value being “Publish block”. Select this option.


In some cases the below warning might appear. If the WebI report you are using as a source is not published in the SAP BusinessObjects enterprise repository then you can’t create a new service.


This is the initial screen for the BI service publishing wizard:


You need to, define a name for the block. The block is the smallest piece of organization for the BI service and it is equivalent to the table you have selected as a data source.


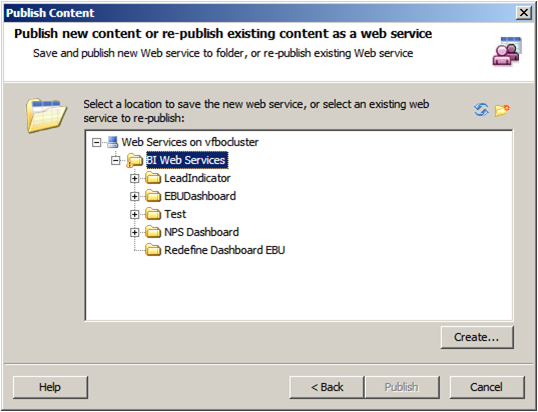
The block can be part of an existing BI service or you can create a new one. Each BI Service can contain one or many blocks. Also the BI Service can be organized in folders. All of these selections are done at the following screen:

For publishing a block on an existing BI service just select the BI service and press the Publish button.

To create a new service, select the folder and click on the Create button below. To create a new folder click on the New Folder button on the upper right side.


So now that your BI service has been created it is time to start consuming it with SAP BusinessObjects Dashboards (Xcelsius).

In the next part of this blog we will talk about SAP BusinessObjects Dashboards (Xcelsius) connectivity to BI services and what we can do to manipulate our new data source.

If you have any questions or tips, leave a comment below.

Implementing SAP Rapid Marts Xi 3.2: Lessons Learned

I would like to share with you two lessons learned about the implementation of SAP Rapid Marts XI 3.2, version for SAP Solutions. In our particular case the customer didn´t allow us make any modification to the out-of-the-box solution, and this must be taken into account when reading the article.

Lesson 1: Don´t be scared by the TSV_TNEW_PAGE_ALLOC_FAILED Error

If part of your implementation of SAP Rapid Marts includes General Ledger, Inventory or Cost Center you will probably have to perform a massive extraction of information from SAP ERP during your initial load. Most probably your customer will have been working with their ERP for quite some time, and you are likely to face the following error:

At this point, you will possibly start looking at configuration of SAP Data Services or you will start trying to tune the SAP ERP configuration in order to achieve the end-to-end execution. In general terms, you will have a headache trying to solve this problem and most likely none of the configurations will work…

The truth is out there… After many hours trying to tune configurations you will understand that the only solution is to modify the ABAP extraction itself… BAD NEWS: your customer does not allow you to do this because this means altering the out-of-the-box product. GOOD NEWS: the guys from SAP Support already tackled this problem and they published the following SAP Note 1446203 - Multiple Query Transforms in ABAP Data Flows, there they clearly explain that your conclusion is correct: this error is a memory allocation error on the SAP solutions server, it indicates that the SAP solutions server has run out of memory for the SAP Data Services generated ABAP program.

You will find an attachment in the SAP Note with some ATLs where they basically tune all the ABAP extractions of the SAP Rapid Marts XI 3.2 package, after applying this ATL to the out-of-the-box solution your extraction will work like a charm.


Lesson 2: How to improve performance of Delta Load for FINANCIAL_DOCUMENT_FACT

This lesson is useful to you if SAP Rapid Mart XI 3.2 General Ledger is part of your implementation.

After finishing the initial load of this SAP Rapid Mart you will start running the delta load. At this moment you may be shocked by the bad performance. Depending of your requirement this delta load can be something simply not affordable.

In basic terms this delta load tries to rebuild all the information of the current fiscal year. We ran an extensive performance analysis and the conclusion was clear: the logic for the processing of delta loads to the table FINANCIAL_DOCUMENT_FACT was causing serious performance issues to our environment.

Only one possible solution was in sight: introduce a new logic for the processing of delta loads to the table FINANCIAL_DOCUMENT_FACT. Breathe deeply because indeed this means to re-invent the SAP solution and this can clearly jeopardize your project.

We decided to come back with this topic to the SAP Support team looking for a “magical solution” and they got it! One more time there was a solution on the SAP Note 1557975 - Poor Performance of Delta Load for FINANCIAL_DOCUMENT_FACT.

The SAP note clearly defines a scenario like ours and provides an ATL file to tune the delta load for the FINANCIAL_DOCUMENT_FACT. Again, after applying the solution provided the delta load worked perfectly.

As conclusion, I would like to mention that after many years working with different support teams I´m impressed with the capability and escalation levels in the SAP Support team. Like many other support teams you may have to push to get a solution but I don´t know many other support teams that can escalate your request up to have a discussion with the director of development of a product or provide you with solutions that fit perfectly to your environments.

That´s all folks! I hope these two tips help you to speed up your SAP Rapid Marts implementations. If you have any doubts please leave a comment below.
Tips for installing SAP BusinessObjects BI4 in Spanish

The Spanish installation of SAP BusinessObjects BI4 is said to frequently crash, and even when it does not, something is still wrong in the server side so SAP BusinessObjects installation administration console does not work as it should and certain formulas used in the front-end side malfunction. This article explains some tricks that can be applied when installing SAP BusinessObjects in Spanish so customers can successfully migrate to the new SAP BO BI4. Folders Security Configuration

When configuring the security for a folder in the SAP BusinessObjects administration console, an issue appears. This can be easily reproduced by installing the software in Spanish, proceeding to enter in CMC and start configuring security. The following error can be seen when entering in Folders Top Level Folder Security:

"A server error occurred during security batch commit: Request 0 of type 44 failed with server error : Plugin Manager error: Unable to locate the requested plugin CrystalEnterprise.ScopeBatch on the server. (FWB 00006) "

There is no other solution rather than to change the Regional Settings of the server from Spanish (Spain) to English (United Kingdom), then this issue is solved.

UserResponse Formula Use

An issue occurs in WebIntelligence when Preferred Viewing Locale is Spanish and Users refresh reports Prompts: A numeric prompt is interpreted as a text with a wrong scientific format when the =UserResponse() formula is used.

The issue can be reproduced taking one object from the official SAP “STS Southeast Demo” Universe, retrieving one object with a prompt and applying the UserResponse() formula as indicated below

In the example stated above the UserResponse() formula should be evaluated to “201010” instead of “2.0101e5”. This can cause serious issues as it is a change Vs. previous software versions because this could be included in many formulas and filters, and could cause a migration project with reports using this frequently used formula to be dramatically extended.

A workaround for this is, for the time being, to keep the Preferred Viewing Locale in English for every user who refreshes information.

So, summarizing, the pieces of advice proposed for a successful installation in Spanish language are:

  • Keep your server with Regional Settings of the server in English (United Kingdom)
  • Configure your BI LaunchPad users to keep the Preferred Viewing Locale in English
  • Keep the BI LaunchPad users Product Locale property setting to Spanish (Spain)

As a result, users will visualise the whole front-end in Spanish language with no errors.

This solution has been tested in latest 4.0 SP4 which includes FeaturePack 3.

The benefit of these workarounds is to provide the market of Spanish language customers with the ability to start migrating to the new SAP BI4 platform with success, and enjoy the product in Spanish language with no bugs.  Hope this helps. If you wish to leave your comment or opinion, please feel free to do so below!

Enterprise mobility for joined-up decision making and greater productivity

As the demand for mobile data explodes and the number of mobile solutions and applications continues to expand, enterprise mobility is gaining momentum at an unprecedented rate.

BI and Social Media – A Powerful Combination (Part 2: Facebook)

To continue with my Social Media series  (read the previous blog here BI and Social Media – A Powerful Combination Part 1: Google Analytics), today I would like to talk about the biggest social network of them all: Facebook. In this blog post, I will explain different alternatives I have recently researched to extract and use information from Facebook to perform social media analytics with SAP BusinessObjects’ report and dashboard tools. In terms of the amount of useful information we can extract to perform analytics, I personally think that Twitter can be as good or even better than Facebook, however, it has around 400 million less users. Facebook still stands as the social network with the most users around the world - 901million at this moment - making it a mandatory reference in terms of social media analytics.

Facebook

Before we start talking about technical details, the first thing you should understand is that Facebook is strongly focused on user experience, entertainment applications, content sharing, among others. Therefore, the user activity is more dispersed and variable as opposed to the real-time orderly fashion that Twitter gives us, which is so useful when building trends and chronological analysis. Hence, be sure of what you are looking for, stay focused on your key indicators and make sure you are searching for something that is significant and measurable.

Relevant Facebook APIs for Analytical purposes

The APIs (Application Programming Interface) that Facebook provides are largely directed at the development of applications for social networking and user entertainment. However, there are several APIs that can provide relevant information to establish Key Indicators that can later be used to run reports. As Facebook’s developer page1 states: “ We feel the best API solutions will be holistic cross API solutions.” Among the API’s that you will find most useful (labeled by Facebook as Marketing APIs), I can highlight the Graph API,  the Pages API, the Ads API and the Insights API. In any case, I encourage you to take a look at Facebook pages and guides for developers, it will be worth your time:

Facebook APIs

Third party applications to extract data from Facebook

I only found a few third party applications to extract data from Facebook’s API that were comprehensive enough to ensure reliable access to data. Below are some alternatives designed for this requirement:

GA Data Grabber: This application has a module for the Facebook APIs, which costs 500USD a year. As in the case of Google Analytics, it has key benefits such as ease-of-use and flexibility to make queries. It may also be integrated with some tools from SAP BusinessObjects such as WebIntelligence, Data Integrator or Xcelsius dashboards through LiveOffice.2

Custom Application Development: It is the most popular option, as I already mentioned in my previous post about Google Analytics. The Facebook APIs admit access from common programming languages, allowing to record the results of the queries in text files that can be loaded into a database or incorporated directly into various tools of SAP BusinessObjects.

Implementation of a Web Spider: If the information requirements are more focused on the user’s interactions with your client’s Facebook webpage or any of its related Facebook applications, this method may provide complementary information to that which is available in the APIs. The information obtained by the web spider can be stored in files or database for further integration with SAP BusinessObjects tools. Typically, web spiders are developed in a common programming language, although there are some cases where you can buy an application developed by third parties, as the case of Mozenda.3

Final Thought

As I have mentioned in my previous post, in the area of Social Media new applications and trends are appearing at a hectic pace, a lot of changes are expected to happen, so it is just a matter of time until we have more and better options available. I encourage you to stay curious on Social Media analytics and its most popular networks, because right now this is a growing gold mine of information.

If you have any questions or anything to add to help improve this post, please feel free to leave your comments.

B-tree vs Bitmap indexes: Consequences of Indexing - Indexing Strategy for your Oracle Data Warehouse Part 2

On my previous blog post B-tree vs Bitmap indexes - Indexing Strategy for your Oracle Data Warehouse I answered two questions related to Indexing: Which kind of indexes can we use and on which tables/fields we should use them. As I promised at the end of my blog, now it´s time to answer the third question: what are the consequences of indexing  in terms of time (query time, index build time) and storage?

Consequences in terms of time and storage

To tackle this topic I’ll use a test database with a very simplified star schema: 1 fact table for the General Ledger accounts balances and 4 dimensions - the date, the account, the currency and the branch (like in a bank).

Simplified Star Schema

To give an idea of the table size, Fact_General_Ledger has 4,5 million rows, Dim_Date 14 000, Dim_Account 3 000, Dim_Branch and Dim_Currency less than 200.

We’ll suppose here that the users could query the data with filter on the date, branch code, currency code, account code, and the 3 levels of the Balance Sheet hierarchy (DIM_ACCOUNT.LVLx_BS) . We assume that the descriptions are not used in filters, but in results only.

Here is the query we will use as a reference:

Select

d.date_date,

a.account_code,

b.branch_code,

c.currency_code,

f.balance_num

from fact_general_ledger f

join dim_account a             on f.account_key = a.account_key

join dim_date d                    on f.date_key = d.date_key

join dim_branch b              on f.branch_key = b.branch_key

join dim_currency c           on f.currency_key = c.currency_key

where

a.lvl3_bs = 'Deposits With Banks' and

d.date_date = to_date('16/01/2012', 'DD/MM/YYYY') and

b.branch_code = 1 and

c.currency_code = 'QAR' -- I live in Qatar ;-)

So, what are the results in terms of time and storage?

Time and Storage Comparison

Some of the conclusions we can draw from this table are:

  • Using indexes pays off: queries are really faster (about 100 times), whatever the chosen index type is.

  • Concerning the query time, the index type doesn’t seem to really matter for tables which are not that big. It would probably change for a fact table with 10 billion rows. There seems however to be an advantage to bitmap indexes and especially bitmap join indexes (have a look at the explanation plan cost column).

  • Storage is clearly in favor of bitmap and bitmap join indexes

  • Index build time is clearly in favor of b-tree. I’ve not tested the index update time, but the theory says it’s much quicker for b-tree indexes as well.

Ok, I´m convinced to use Indexes. How do I create/maintain one?

The syntax for creating b-tree and bitmap indexes is similar:

Create Bitmap Index Index_Name ON Table_Name(FieldName)

In the case of b-tree indexes, simply remove the word “Bitmap” from the query above.

The syntax for bitmap join indexes is longer but still easy to understand:

create bitmap index ACCOUNT_CODE_BJ

on fact_general_ledger(dim_account.account_code)

from fact_general_ledger,dim_account

where fact_general_ledger.account_key = dim_account.account_key

Note that during your ETL, you’d better drop/disable your bitmap / bitmap join indexes, and re-create/rebuild them afterwards, rather than update them. It is supposed to be quicker (however I’ve not made any tests).

The difference between drop/re-create and disable/rebuild is that when you disable an index, the definition is kept. So you need a single line to rebuild it rather than many lines for the full creation. However the index build times will be similar.

To drop an index: “drop index INDEX_NAME”

To disable an index: “alter index INDEX_NAME unusable”

To rebuild an index: “alter index INDEX_NAME rebuild”

Conclusion

The conclusion is clear: USE INDEXES! When properly used, they can really boost query response times. Think about using them in your ETL as well: making lookups can be much faster with indexes.

If you’d like to go any further I can only recommend that you read the Oracle Data Warehousing Guide. To get it just look for it on the internet (and don’t forget to specify the version of your database – 10.2, 11.1, 11.2, etc.). It’s a quite interesting and complete document.

B-tree vs Bitmap indexes - Indexing Strategy for your Oracle Data Warehouse Part 1

Some time ago we’ve seen how to create and maintain Oracle materialized views in order to improve query performance. But while materialized views are a valuable part of our toolbox, they definitely shouldn’t be our first attempt at improving a query performance. In this post we’re going to talk about something you’ve already heard about and used, but we will take it to the next level: indexes.

Why should you use indexes? Because without them you have to perform a full read on each table. Just think about a phone book: it is indexed by name, so if I ask you to find all the phone numbers of people whose name is Larrouturou, you can do that in less than a minute. However if I ask you to find all the people who have a phone number starting with 66903, you won’t have any choice but reading the whole phone book. I hope you don’t have anything else planned for the next two months or so.

Searching without indexing

It’s the same thing with database tables: if you look for something in a non-indexed multi-million rows fact table, the corresponding query will take a lot of time (and the typical end user doesn’t like to sit 5 minutes in front of his computer waiting for a report). If you had used indexes, you could have found your result in less than 5 (or 1, or 0.1) seconds.

I’ll answer the following three questions: Which kind of indexes can we use? On which tables/fields shall we use them? What are the consequences in terms of time (query time, index build time) and storage?

Which Kind Of Indexes Can We Use?

Oracle has a lot of index types available (IOT, Cluster, etc.), but I’ll only speak about the three main ones used in data warehouses.

B-tree Indexes

B-tree indexes are mostly used on unique or near-unique columns. They keep a good performance during update/insert/delete operations, and therefore are well adapted to operational environments using third normal form schemas. But they are less frequent in data warehouses, where columns often have a low cardinality. Note that B-tree is the default index type – if you have created an index without specifying anything, then it’s a B-tree index.

Bitmap Indexes

Bitmap indexes are best used on low-cardinality columns, and can then offer significant savings in terms of space as well as very good query performance. They are most effective on queries that contain multiple conditions in the WHERE clause.

Note that bitmap indexes are particularly slow to update.

Bitmap Join Indexes

A bitmap join index is a bitmap index for the join between tables (2 or more). It stores the result of the joins, and therefore can offer great performances on pre-defined joins. It is specially adapted to star schema environments.

On Which Tables/Fields Shall We Use Which Indexes?

Can we put indexes everywhere? No. Indexes come with costs (creation time, update time, storage) and should be created only when necessary.

Remember also that the goal is to avoid full table reads – if the table is small, then the Oracle optimizer will decide to read the whole table anyway. So we don’t need to create indexes on small tables. I can already hear you asking: “What is a small table?” A million-row table definitely is not small. A 50-row table definitely is small. A 4532-row table? I´m not sure. Lets run some tests and find out.

Before deciding about where we shall use indexes, let’s analyze our typical star schema with one fact table and multiple dimensions.

Star schema with one fact table and multiple dimensions

Let’s start by looking at the cardinality column. We have one case of uniqueness: the primary keys of the dimension tables. In that case, you may want to use a b-tree index to enforce the uniqueness. However, if you consider that the ETL preparing the dimension tables already made sure that dimension keys are unique, you may skip this index (it’s all about your ETL and how much your trust it).

We then have a case of high cardinality: the measures in the fact table. One of the main questions to ask when deciding whether or not to apply an index is: “Is anyone going to search a specific value in this column?” In this example I´ve developed I assume that no one is interested in knowing which account has a value of  43453.12. So no need for an index here.

What about the attributes in the dimension? The answer is “it depends”. Are the users going to do searches on column X? Then you want an index. You’ll choose the type based on the cardinality: bitmap index for low cardinality, b-tree for high cardinality.

Concerning the dimension keys in the fact table, is anyone going to perform a search on them? Not directly (no filters by dimension keys!) but indirectly, yes. Every query which joins a fact table with one or more dimension tables looks for specific dimension keys in the fact table. We have got two options to handle that: putting a bitmap key on every column, or using bitmap join keys.

Further Inquiries...

Are indexes that effective? And what about the storage needed? And the time needed for constructing/ refreshing the indexes?

We will talk about that next week on the second part of my post.

Asista al SAP Roadshow Innova Pyme 2012 con Clariba y com&Geinsa

 Descubra como las aplicaciones de análisis de negocio de SAP le pueden ayudar a acceder a información en la que basar sus decisiones con seguridad y actuar para mejorar el rendimiento de  su empresa.

REGÍSTRESE HOY


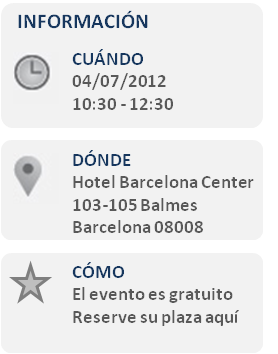
Atienda a nuestro evento el 4 de Julio de 10:30 a 12:30 y descubra lo que su empresa puede lograr con las soluciones SAP.

En el SAP Roadshow Innova Pyme 2012 usted tendrá la oportunidad de hablar  con los consultores de com&Geinsa y Clariba, partners de SAP con años de experiencia en soluciones de gestión de la información. Ellos le proporcionarán información sobre cualquier consulta que formule, o concretaremos el poderle ver con  una atención más personalizado.

La agenda del evento es la siguiente:
  • Cafes y pastas de bienvenida
  • Introducción
  • Presentación de SAP BI para BusinessOne
  • Demostración del Cuadro de Mandos para Finanzas y Ventas
  • Preguntas y respuestas
  • Agradecimientos y Despedida

Esperamos verle próximamente en nuestro SAP Roadshow Innova Pyme 2012. El evento es gratuito, para registrarse por favor HAGA CLIC AQUÍ.


Un cordial saludo,

Marc Haberland Director General Clariba

_______________________________________________________________

Acerca de Clariba

Clariba ofrece soluciones innovadoras y fiables en business intelligence, proporcionando a clientes en más de 15 países la visión que necesitan para mejorar su rendimiento empresarial. Nuestros consultores son certificados y expertos en la planificación, desarrollo y instalación de SAP BusinessObjects. www.clariba.com

Acerca de com&Geinsa

com&Geinsa lleva más de 30 años aportando soluciones para rentabilizar al máximo los sistemas de información de su empresa, sin perder de vista la evolución de la tecnologías como movilidad y cloud. En com&Geinsa somos expertos en hacer de SAP una solución única para su empresa. www.comgeinsa.com


What keeps you up at night? Information Management Nightmares

Clariba recently carried out a survey about information management with participants at an event. The results were quite interesting since we had most participants mentioning the same pain points; therefore we have decided to share them in this article. To carry out the survey, we used  simple statements that people could identify themselves with - divided into two areas: Business and Technical.  We then asked participants to fill a one-page questionnaire, asking them to check all the pain points they were facing (they could check multiple pain points).

BI Pain Points questionnaire

Business Pain Points

When it came to the business side, 45% of respondents affirmed that their boss constantly pushes them for more information. This is a very sensitive topic. We all know that companies can´t afford to make decisions that aren´t based on facts. Therefore if you are the responsible for gathering these facts, you will be under constant pressure. This would be something simple to deal with if it was easy to gather the information you need. However, when we see that 35% of participants complained they are spending too much time consolidating information and 30% did not manage to get all the information they need, we understand why this becomes a big issue. Business intelligence platforms should not only provide you with all the insight you need, but should make it easily available. It can be a daunting task when you have to wait for IT to return queries for a business question you have to answer or when you have to compare 3 different sources of data to find out the true value before a meeting taking place 1 hour from now.

Another common dissatisfaction was around data obsolescence. 40% said their BI systems only provides historical data and they can´t see how the company is performing right now. This can be caused by not having a proper data warehouse in place, or having one that is not refreshed as often as it should or having poorly designed ETL processes. Whatever the reason is, it can lead to poor decision making. When business moves at the speed of light (in a call center for example), to rely on old information can be misleading.

Another issue related to data obsolescence appeared when 40% said they like Microsoft Excel as a tool to manipulate information, but they are not getting fresh data. If you have to prepare presentations or send emails that include Microsoft Excel data, and you have to manually update them not only will you spend a lot of your time on it, but you are also subject to making mistakes. Business intelligence tools must allow users to optimize their time, while reducing manual labor thus minimizing mistakes.

Survey Results - Business

 Technical Pain Points

On the technical side of our survey, the most common complaint was around workload related to information management. 55% of participants stated that their department is completely overloaded. This is also connected to another popular complaint: 45% of respondents state that they have system users calling them all the time. If users don´t have the autonomy to create their own reports and need IT for every query they have to run, the department will become a bottleneck. That´s why offering business users easy-to-use tools that give them the freedom they need to draw insight from corporate data on their own is so important, as it speeds up the information sharing process.

Another frequently mentioned pain point on the technical side is that 40% respondents are not getting the support they need for their BI system. When a problem happens in the BI platform, the impact on a company can be huge, as people make their decisions without trustworthy data to guide them. Therefore, the right support is vital to the correct function of a business, both in SAP licenses and on the BI solutions implemented.

Finally, 35% of respondents don't have the visibility into how their BI systems are being used. When IT has no idea how the system is being used, they cannot optimize the server and the licensing, they can´t understand their users and they can´t be proactive, forecasting when changes will be needed. They need to be able to understand what is going on in their BI applications and ensure BI environments are performing appropriately.

Survey Results - Technical

How to Solve These Issues?

Whether you use Microsoft Excel, a legacy BI system or an SAP BI solution, Clariba  can help you solve data management issues that you face on a daily basis.  Clariba´s solutions, which are based on SAP BusinessObjects, the leading BI platform in the market today, can help business users and IT departments to resolve their concerns.

With the full range of SAP BusinessObjects BI modules we are able to provide companies with the solutions they need. We are also capable of developing optimal ETL processes and Data Warehousing with our Data Management services to make sure you have high quality data analysis.

Furthermore, we can ensure your systems are performing to their maximum capacity. Our Support Center has been certified by SAP to provide support on SAP BusinessObjects licenses and also on BI systems and implementation. If what you are looking for is to monitor your BI system, we have recently developed PerformanceShield, a solution that ensures an effective management of your Business Intelligence (BI) system, which is critical to guarantee your organization is optimizing its investments on BI.

Not sure where to begin? The first step is a 360 BI Assessment, based on best practices and an in-depth understanding of your BI platform, tools, content and licenses. If your current BI system has any gaps or challenges, SAP BusinessObjects and Clariba will recommend steps for making it more secure, stable or efficient for all your users and audiences.

If you feel any of the pain points mentioned, or any of the other ones that appear in the graphs, contact Clariba and find out how you can make the best of your investments in business intelligence.