""

SAP BusinessObjects

SAP Business Objects XI 4.0 Release: Connecting to OLAP data sources

In March the new SAP Business Objects 4.0 release came to the scene containing a lot of new interesting features. Today I’m going to describe how to configure a connection to an OLAP data source by using some of the new tools and features in SAP Business Objects XI 4.0. In order to successfully follow the instructions outlined in this article, it is best to ensure that the below prerequisites are met:

  • Windows Server 2008.  The server configuration needs to be enabled as a Web Server (IIS) role.
  • SAP Business Object XI 4.0.
  • SQL Server 2008 & Microsoft Analysis Services. The example database “Adventure Works” should be installed and the OLAP cube’s examples deployed in Microsoft Analysis Services.

Setting up the OLAP Connection

First of all, in order for you to create an OLAP connection you will have to configure IIS to provide you the access to the OLAP cube stored in Microsoft Analysis Services.

Configuring IIS

Just follow these steps and you’re on track:

1.  Firstly we create a folder called “Olap” in the root path of IIS in the machine, by default the path should be: C:inetpubwwwroot

2.  Copy the files required to create the connection with Analysis Services. These files, which are set as a default installation of SQL Server 2008, are stored in the following path:

C:ProgramFilesMicrosoftSQLServerMSAS10.MSSQLSERVEROLAPbinisapi.

Copy all files contained in this folder and paste them in the “Olap” folder which we have created in step 1.

At this point, this is what we should be able to visualize:

XI4
XI4

3.  Launch Internet Information Services (IIS) Manager. You will find it in Control Panel under Administrative Tools.

SAP XI 4
SAP XI 4

4.  In the Connection panel we then open the tree of sites. We right click in Application Pools and select the option Add Application Pool.

SAP XI 4(2)
SAP XI 4(2)

5.  This is how the configuration of the pool should appear to us:

SAP BO XI4
SAP BO XI4

6.  Now, within the list of  Application Pools available to us, we are able to see the Olap pool. Simply right click on the Olap pool and select Advanced Settings. Once we have reached this setting, it´s extremely important that we set the option "Enable 32-bits Application" to FALSE. This is a critical step because, unless this option is set to FALSE, the connection won’t work.

SAP BO XI4
SAP BO XI4

7.  We continue by right clicking in the Olap site and selecting the option Convert to Application.

SAP BO XI4
SAP BO XI4

8.  In the configuration window we press the Select button and choose the Application Pool that has been created. This is how the configuration should appear:

SAP BO XI4
SAP BO XI4

9.  Now select the Olap site in Connections. In the right panel we will be able to see different categories. Double click in Handler Mappings.

10.  On the upmost right section of the panel you will now be able to visualize the Action’s panel. From here select Add Script Map. A configuration panel will pop up, and this is how it should appear to us:

XI4
XI4

11. Now we proceed to setting up the Configuration of Authentication. Click in Connections in the Olap site and double click on the Authentication category which is in the right panel.

12. In the right panel you can now see the types of authentications available. Right click on Windows Authentication and enable.

SAP BO XI4
SAP BO XI4

Configuring Analysis Services 2008

Now our following step consists in configuring the Analysis Services which means having to modify the security settings. This is why if you follow the instructions in this article to setup a production environment please check your security implications. For more information on this matter please click here.

1. Launch SQL Server Management Studio and connect to your Analysis Services Server

2. Right click on the server and select Properties.

XI4
XI4

3. In the left panel select the option Security.  In the right panel we can see the Server Administrator. Click on the Add button in the lower left part of the window.

4. Type the name IUSR in the box and press Check Names. Finally press OK.

5. Now we can see the account IUSR in the list of Server administrators.

XI4
XI4

Connecting SAP Business Objects XI 4.0 to OLAP

There are various ways to creating a new connection in SAP BO 4.0 and accessing the OLAP cube. In this article we are going to focus on the use of a new tool introduced in SAP BO 4.0 called the Information Design Tool (IDT). The IDT is the SAP Business Objects design environment for creating and publishing new SAP Business Objects universes and connections. To finalize the process we’ll create a new OLAP Universe using the Universe Design Tool and lastly create a simple report with Web Intelligence 4.0 which will allow us to test the access to the data source.

Creating the OLAP Connection

Proceed in the following manner:

1. Launch the Information Design Tool

2. Create a New Project, go to File, New, then Project

3. Enter the Project Name, the location (optional) and press Finish

4. Go to File,New, OLAP, Connection to start creating the connection to the OLAP data source.

5. Enter a Name for the connection, a description (optional) and press Next

XI4
XI4

6. In the next screen we have to select the driver for the connection, in our case Microsoft Analysis Services 2008, and Press Next

7. Enter the parameters of the connection, this is what you should be visualizing:

XI4
XI4

8.  Select the cube for the connection and press Finish.

XI4
XI4

If you have managed successfully in your task thanks to following these steps, you have been able to create a new connection and now all that is left is for you is to publish this connection in BO. This is how it is done.

1. Right click in the new connection and select the option Publish connection to a Repository

2. Enter the credentials for connect to your BO repository and press Connect

3. Select a location for the connection and press Finish.

Creating an OLAP Universe

For testing purposes we are going to create an OLAP Universe using the new connection.

1. Launch Universe Design Tool and enter your credentials to access the server

2. Go to File, from there to New

XI4
XI4

3.  Enter the parameters of the universe, select the connection created and press OK. This is how it should appear:

19
19

The universe will automatically load the structure and objects of the cube.

XI 4
XI 4

Creating a Report Web Intelligence

Once all this has been done, let us look into creating a Report Web Intelligence:

1. Launch Interactive Analysis Desktop

2. Select the Universe

XI 4
XI 4

3. Enter the credentials to access to your BO server

4. Select the Universe created and press Select, in our case the set example is OLAP Universe

5. Create a Query and press Run Query.

XI 4
XI 4

At this stage, having accurately followed these steps, we should now have a new report displayed in front of us, allowing us to use the Universe which we have designed with the OLAP connection, to access the information in the cube stored in Analysis Services 2008.

XI 4
XI 4

I hope you found this article of your interest and for any suggestions or queries regarding SAP Business Objects XI 4.0 please leave a comment and I will readily reply to you.

Making peace with the enemy: SAP BusinessObjects Live Office XI 4.0

The most common scenario that I’ve  faced with so far, after quite some years giving BI pre-sales presentations and implementing BI systems for customers, has been that of meeting members of an overloaded IT department who direct their efforts into developing complex reports with BI tools for a group of business users who, in the end, will simply export the information delivered to them to an Excel sheet and work on it directly.

For decades, most BI vendors have tried to convince users to give up Excel sheets and instead work with more flexible and user friendly BI tools. But it’s an acknowledged fact that nowadays millions of people around the world use spreadsheets on a daily basis. The time has come for vendors to take off their blinders and to act upon what is happening. Already some have been readjusting their strategies and roadmaps, and have shifted towards accepting Excel as a presentation layer for data thereby providing the necessary integration with it.

This article is about how SAP BusinessObjects tackles this challenge and goes one step further in terms of tools integration thanks to the new features of the latest release XI 4.0.

With Live Office, it is possible to insert content from Web Intelligence, Crystal Reports and also Universe Queries directly into Microsoft Office documents (PowerPoint, Word, Excel or Outlook). Furthermore, when opening the very document at a later time, it is possible to refresh the embedded objects and retrieve up-to-date data in the document.

This is truly an advantageous solution and I have had the opportunity to use this technology with some customers, who continue employing their traditional form of reporting with an Excel sheet but can now combine this with error-free data obtained directly from their business systems.

In the latest release of Live Office, a new functionality loads the data selection of Microsoft Excel to SAP BusinessObjects Explorer, a flash-based tool that allows further analysis in a very visual and intuitive way. Moreover, the results from a completed analysis can also be downloaded to other applications, such as Outlook and PowerPoint to further the study or to simply send by email.

Live Office XI 4.0

If you have any questions regarding Live Office XI 4.0 and its uses in a customer environment, feel free to leave a comment and I will follow up with you.

Sewing the initiatives on a customer’s strategic suit (with SAP SSM 7.5)

All through my ongoing project in Abu Dhabi, I have never turned down any of the challenges that arise while working with my customer. The project in question involves the customer looking through the tools I propose as if they were a collection of nice suits, but all in the wrong size.
At this stage we need to proceed like a tailor would: we can’t presume that our customer is going to lose/gain the weight to fit into the clothing we want to sew for them, but rather we need to tweak the outfit here and there until we get the perfect fit for our customer.

We would never think of recommending a diet and most certainly wouldn’t add more stitches to their outfit. Today what is most pressing is that we talk about our customer’s strategy, and how to adapt SAP Strategy Management (SSM) to our customer’s needs.

One of the requests I have received is related to the implementation of the Initiatives.

But what does "Initiative" mean? According to strategic management experts Kaplan and Norton, "an Initiative organizes people and resources and dictates which activities are required to accomplish a specific goal by a particular date; Initiatives provide the how while goals provide the what."

During a demo presentation of SSM, as I was illustrating the properties of Initiatives, my customer asked me: "What if the Initiative depends directly on the achievement of the last milestone? What if I want to consider an Initiative as green (ok) even if the first milestone has not been achieved on time but the rest of them were met ahead of schedule?"

As always, the quickest and easiest answer would be "it is not possible", but our sales mentality automatically converts that answer in "it is not an out-of-the-box solution provided by the tool". No matter how you put it, the customer wants to hear that "it is possible".

Which answer did I give to the customer? Well, whatever I said, now the customer knows that it is possible to configure the Initiatives as sequential.

So let’s check what we did to create our sequential and not sequential Initiatives (based on sequential/not sequential milestones).

Initiatives (sequential milestones, not sequential milestones)

  • Sequential Milestones: The status of the Initiative needs to be synched up with the status of the last Milestone. The status of the other milestones will not affect the schedule status of the Initiative (i.e. the delay of the milestone does not mean a failure of the Initiative whether or not the last milestone will be achieved on time).


  • Non sequential Milestones: The status of the initiative will be set as not achieved even if only one of the milestones has not been achieved. Out of the box solution with SSM.


Validation Rules

  • The milestones values can't be meaningless based on user input. I.e. 40% complete without setting an end date or 100% complete with no end date (2nd case more acceptable).

The big question that arises after having explained what we solved is: “how did we solve it?” Basically, we managed to interact with the SSM tables when a new Initiative is created (based on rules).

General Rules: We manage the percentage and the end date of the milestones to avoid the following scenarios:

  • Milestone 100% completed without setting an end date: Populate the end date with the actual date whether the percentage is equal to 100%.
  • Milestone <100% completed with an end date already set: Automatically change the percentage to 100% as soon as an end date is set.

Sequential Initiatives:

  • The user needs to write the word “@Sequential” at the beginning of the description of the Initiative. The tool will automatically apply the rules defined by our customer and by us.
  • We apply an end date to the Initiative and a status color based on the results of the last milestone.

Non-Sequential Initiatives:

  • The user can write a different description than "@Sequential" and SSM will automatically behave as set out-of-the-box.

This solution adds value to Strategy Management and helps our customers feel more comfortable in a suit which is tailored to fit their needs. This solution can be applied to SQL server, MaxDB or Oracle installations.

For more information/consultancy on this or any other custom solution with SSM, please contact us at info@clariba.com

Loading Status Animation in Xcelsius

Often when developing a dashboard with Xcelsius we have connections to a DataBase, either with LiveOffice or QaaWS (Query as a Web Service). This leaves us with only two options to refresh our dashboard: either we proceed once all the Xcelsius components are loaded or, alternatively, change a radio button, combo box or any of the components related to the connection objects. In both these examples, when having to manage large amounts of data, we would normally wait until the connection returns our request. This can be frustrating, especially when we don’t have any indicator to signal that the data is being processed. In this article I will illustrate a convenient solution to this problem.

  • First of all we need to create the objects that will be displayed while the query is loading the data: I would advise to start by creating a rectangle as a fake layer. Once this has been done we create another image that will be our animation.

We have many possible animations:

View the flash file: Loading Animations in Xcelsius

This is how the animation appears:

View the flash file: Xcelsius Animation

  • We then group these two objects and bring them to the front.

  • In a spreadsheet we create a cell where we bind the status of the query.

  • Reached this point, under properties in QaaWs or in Live Office connection we follow these steps:

In the Usage tab:

Load Status section:

  1. In the Loading Message cell we hardcode a "L"
  2. In the Idle Message cell we hardcode a "C"
  3. In the Insert In option we should map the cell of the spreadsheet, in our case "B1"

  • Finally we select the group that we had previously created, and in the dynamic visibility window we map the Status to the "B1" cell and the key to an "L". This means that while the query is loading, we can simultaneously view the group.

The final result is as displayed below.

This strategy contributes to providing a user friendly environment in particular in those situations of slow data retrieval.

If you have any questions or suggestions about this solution, please feel free to leave a comment and I will gladly reply.

Creating Dynamic WebI Documents

Often we are forced to find a solution to make our Web Intelligence reports more dynamic, because of a specific user need or for the purpose of sales demos. In this case we can add some interactivity to make our presentations livelier and more visually appealing. In this post you will find some examples for achieving more dynamic WebI reports that don’t come with the out-of the-box WebI standard module:

  1. Dynamic columns
  2. Hiding and Unhiding blocks
  3. Hiding and Unhiding blocks in sections

The techniques explained below are valid not only for tables but also for graphs.

1. Dynamic Columns:

The purpose of this technique is to change the value of a dimension column according to a selection from its input control. Below you will find the high level guidelines for creating dynamic columns:

  • Create a dummy table in the Universe; ideally a derived table with the name of the descriptions you want the user to display and to show in the document. You can see a sample below:
Dummy Table WebI
Dummy Table WebI
  • These dynamic variables should come in a separate Query and be linked with the real data coming from a second Query. Alternatively all data could come from a single Query. If the variables and the data to present are not linked, our solution will not work.
  • The next step is to create the Input Control making sure that the filter applied affects either the entire report or a specific table, depending on where the dynamic columns are located.
  • Once we have all this, we need to build the table or block where our "Dynamic Column" will be located and build a conditional formula with IF and ELSE features. Using our example, if our dynamic variable is called Input control, if the information we want to show is located in the Period table and if the dynamic source fields are Month, Week & Day, then the formula should be the following: =If("inputControl"="Month";[Period.Month];If("inputControl"="Week";[Period.Week];If("inputControl"=”Day”;[Period.Day]))) Make sure the formula sentence is properly defined so that a meaningful result will be displayed when the user applies the "All values" option.

For a more detailed explanation on this topic you can check the Clariba blog article:  How to Use WebIntelligence Input Controls Efficiently from 22nd January 2011 at www.clariba.com/blog.

2. Hiding / Unhiding blocks

  • The purpose of this technique is to hide one table and show another with dimension columns by changing its value according to a selection from its Input Control:
  • Create a dummy table (like in the example above) with the options we want to show to the user and for the purpose of linking two Queries (i.e. with the word “LINK”)
  • Create a table with all the data you want to show.  After that, it is necessary to uncheck one of the properties that our block/table has by default. Select the proper block, go to properties, deploy the "Display" option and make sure that the "show when empty" property is not active.
  • The next step is to create the Input Control, making sure that the filter applied affects the entire report.
  • Next we need to play around with the filters for the different blocks. The object with the word “LINK” needs to be used like a filter for every single block (equal to). After that we apply a filter with the object we used before for the Input Control, making sure that the option for this filter is “not equal to” the value that corresponds to the actual table. We need to do the same with all tables.

3. Hiding / Unhiding blocks in sections:

Imagine we have a report where we want to split a trends table into sections showing the trends in "Months", "Weeks" and "Days". The section could be too long and the user may not want to scroll down to find a specific one.

  • In this case,  we would make three different tables, one for Months, one for Weeks and the last for Days and place them in the section, making sure that we change the names on the top of the table so that users can  easily recognize them.
  • Select the different blocks and disable "show when empty" selection from the properties. Create three different Input Controls with all values, one for every possible trend. Establish connections between these and their corresponding table.
  • Make sure that the Input Control has one value by default, so only one table is visible. This way when the user makes a selection in a single "trend" Input Control, the corresponding block will be displayed correctly; whereas if the user deselects all the options in the Input Control tables, all the blocks will be visible.

The techniques explained above were developed by our team of Web Intelligence developers to provide business users with the added value of interactivity in their queries, analysis and navigations.

If you have any questions or feedback about these solutions, please feel free to leave a comment below or send an email to info@clariba.com

Easy-to-maintain WebI Reports

Creating Web Intelligence reports is not the most challenging task for a BusinessObjects consultant, but it can be very time-consuming. Imagine your client asks you to create one document with 50 reports, and he's not sure yet how the reports should look. How can you create all these reports and at the same time make sure that they're easy to update?

That is indeed a very important question. Imagine you've already created the 50 reports, one in each tab, and your client suddenly decides that the label for totals should not be "Total (1000 EUR)" but rather "Thousand Euros". And instead of this gray background you decided to use by default, the client would like to have their corporate blue.

What will happen if you didn't think about it (or read this article) before? You'll end up changing the 50 reports one by one. Ok, it shouldn't take more than 60 or even 30 minutes, but you probably have a better use of your time, right?

So let's look at a few tips:

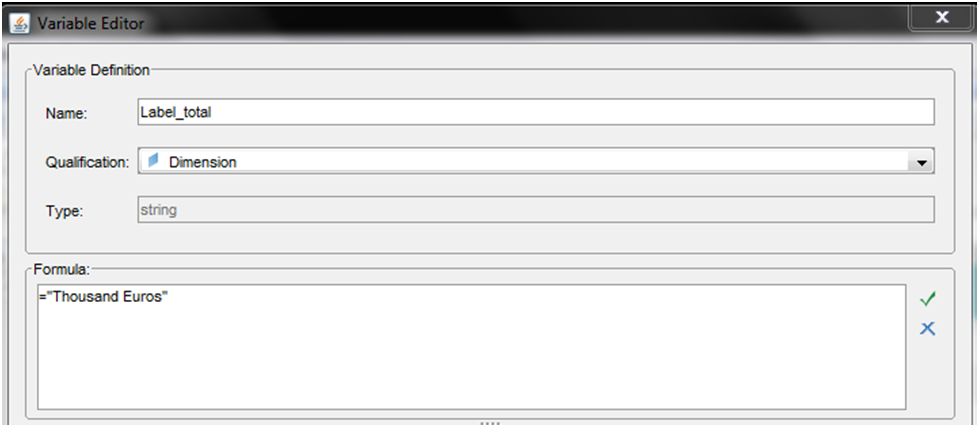
  • Use variables. The variables are not only quite useful for creating new measures, they're also great as labels. If you had created a variable Label_total (as a dimension) with the value "Total (1000 EUR)" and written in each total name cell "=[Label_total]", then the change would be quite easy. Just edit the variable and there you are! The label is now correct on your 50 reports.

  • Use alerters. Alerters are like "conditional formatting" in Excel. Define a condition, a format, and if the condition is met, then the cell with the alerter will be formatted. This is necessary when you really need formatting to depend on a condition, but it's also a useful tool for easy maintenance. For the condition, choose something always true (for example create a variable always equal to 1, and define the condition in the sub-alerter as "Is this variable equal to 1"). For the formatting, just choose how you want the cell to look (for example with the grey background). Apply this alerter to all cells which should have this background. Now, if you need to change the color, you only need to change the alerter, not all the cells in the 50 reports! Note that unlike in Excel you can also put text in the formatting. So you can actually also use alerters for labels; the downside being that you lose in clarity (you can have something written in the cell's formula and something else displayed because of the alerter).

Hopefully this post has provided you with some time-saving tips for your WebI reports that will also help you to easily maintain and update them. If you have some other WebI tips to share, please feel free to leave a comment below!

SAP BusinessObjects: Through the Eyes of Critics and Clients

In our day-to-day life we are exposed to many purchasing decisions. Going to the supermarket to get some food or buying widgets in an internet shop is no longer a quick and easy task. The diversification of vendors forces us to go through a conscious or unconscious decision making process. It is always interesting to study the reasoning that leads to an action, especially for marketing people, and it is a social phenomenon in constant evolution, ranging from the traditional word of mouth to the most modern surfing of internet forums.

The same happens when a company has the opportunity to make a BI investment and has to choose a vendor that fulfills their particular needs. There are some specialized consulting companies that carry out complex market studies, but the feedback received from clients or contacts is just as influential to the decision making process.

This blog article is focused on the latest studies from Gartner and Forrester regarding SAP BusinessObjects.

The Forrester Wave: Enterprise Business Intelligence Platforms, released during the last quarter of 2010, considers SAP BusinessObjects to be leading the market together with IBM Cognos, Oracle and Information Builders, followed by SAS, Microsoft and MicroStrategy close behind. The 145 criteria used correspond to vendor surveys, product demos and customer reference surveys.  The end result is a graph that situates BI vendors in relation to their current offering and strategy.

SAP BusinessObjects is recognized as having very good BI tools for each job:

  • Crystal Reports as top report writer embedded in thousands of applications;

  • Explorer as a combination of the power of OLAP and the simplicity of search, exploration and analysis;

  • SAP BusinessObjects Dashboards is very popular amongst executives that can visualize the generated flash in disconnected mode and no SAP software installed;

  • BEx being still the most widely used and popular query and analysis tool for SAP BW users;

  • Business Warehouse Accelerator with the speed of in-memory database to provide a powerful DBMS optimized for BI;

  • SAP is also leading in self-service BI software as a service (SaaS) offerings.

According to Forrester, the downside of having all these tools is a poor product integration and a lack of object reuse from product to product, which is supposed to be improved with the new release BI 4.0 in Q1 2011.

Gartner’s Magic Quadrant for Business Intelligence Platforms, released in January 2011, considers the same leader vendors as Forrester and also adds QlikTech thanks to its recent continued growth. It uses standard criteria divided into two categories: completeness of vision and ability to execute. According to the study, a good strength is to have the largest share of the BI platform market (combination of SAP NetWeaver BW and SAP BusinessObjects) with an installed base over 46,000 customers and one of the largest channel and services ecosystems. Reporting and ad-hoc querying capabilities were rated high by customers, whereas other SAP NetWeaver BW tools were below the market average. However, in regards to OLAP, BEx Analyzer seems to be more widely used than Voyager. The complements to the BI platform are also seen as positive: collaboration and decision support (StreamWork), Text Analysis, search-based data exploration with its Explorer product, and the enterprise information management products with data integration, lineage & impact analysis, and data quality. The vision for an in-memory appliance, HANA, promises to solve many of the perennial performance issues of large complex BI deployments in general (given its SQL and MDX access for third-party BI tools) and SAP BW in particular. As also reported by Forrester, SAP has been one of the first of the leading BI vendors to introduce a SaaS offering, BusinessObjects OnDemand BI. In addition, SAP has also made investments in mobile BI with its Sybase acquisition and the SAP BusinessObjects Explorer iPhone/iPad application.

In the cautions part of the report, Gartner mentions some concerns that customers have about the roadmap after product changes to support optimizations with the SAP Business Applications and NetWeaver BW products, and also a perceived higher cost of ownership. Migration, implementation and integration choices are reported to be confusing by some customers. Finally, ratings for support, software quality and sales experience are unfortunately low compared to other vendors in the survey. This is currently being address by SAP; they are giving more and more importance to Channel Partners like Clariba, which can provide high quality uninterrupted support, much more aligned to the customer needs.

If you have any questions or comments about the Gartner or Forrester summaries mentioned in this article, or would like more information about Clariba’s SAP BusinessObjects services, please leave a comment below or contact us at info@clariba.com.

Installing Business Objects on Linux – Part 1: Preparing Your System

At Clariba we have seen a clear dominance of Windows operating systems during our Business Objects implementations. But what happens when we face the challenge of a Business Objects implementation on a Unix-like system? What are the main differences? How does the consultant need to prepare? What are the pre-requisites? What are the risks and possible ways to overcome them?

We were recently challenged with these questions and we wanted to keep track of this experience and share it with everyone. So I will share below some tips for implementing Business Objects on a Unix-like architecture, more specifically: Linux.

The intention of the first part of this article will be to focus on how to prepare your Linux distribution so the installation runs smoothly. I will follow up with a future article to go into additional details about the Linux setup.

Step 1 – Defining your environment

In any implementation, prior to execution, it is vital to define the scenario you will be facing. This is even more important when implementing on a Linux system. The most important fact you need to know is what type of Linux you will be using and if it is supported by Business Objects.

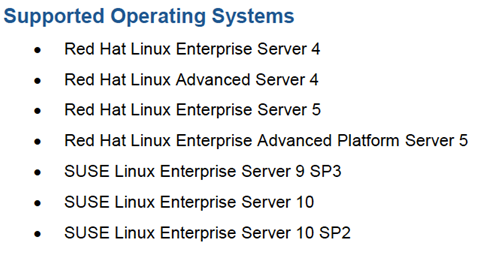
Officially the Linux distributions supported by Business Objects are Red Hat and SUSE (although other distributions like CentOS have also been proven to work due to similarities with Red Hat).

Linux Operating Systems

It is a must to go through the supported documents pdf for Linux available at the SAP Marketplace. In this document you will find specific details on the versions and patch level that you need to comply with in order to install Business Objects.

BOE XI 3.1
BOE XI 3.1

Step 2 – Preparing the Linux box

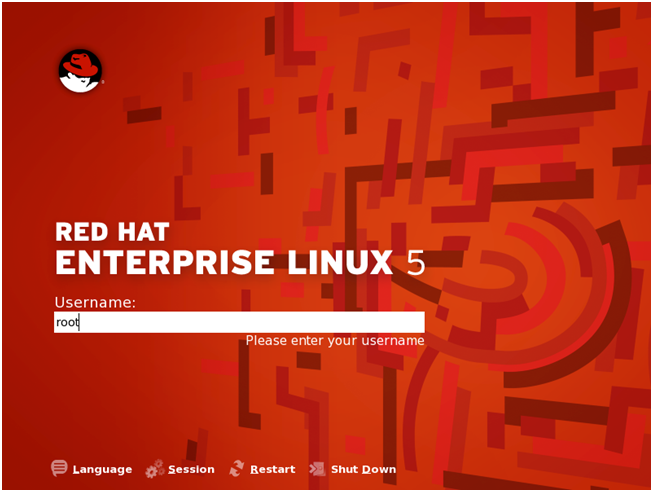
Root Access and Installation User First of all you need to have root access to the system. Although this is not required for the setup, along the way there will be modifications that need to be made to the system that require root privileges.

Also make sure there is at least one additional user in the system. This user will be the executor of the Business Objects setup. Most current Linux distributions already create an additional user at setup.

Red Hat Enterprise Linux 5

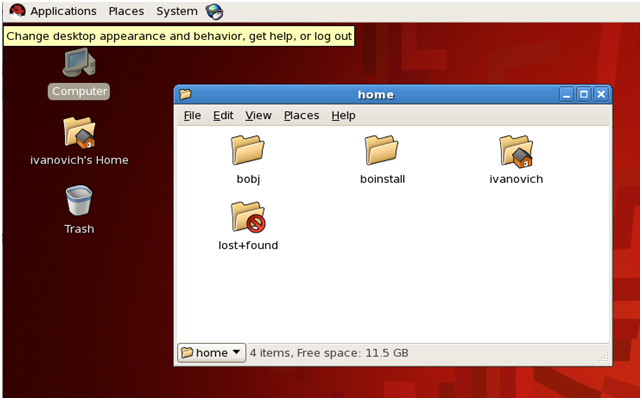
Install Files Download the installation files for Linux and save them on a folder that references the installation sources (i.e. /boinstall). Also create a new folder where the BO system will reside (i.e. /bobj)

Installing files in Linux

Modifying Your System Now it is time to get our hands dirty. The following modifications need to be made to your Linux system in order for the Business Objects installation to run smoothly. It is advisable to have a minimum level of knowledge around Linux administration and terminal console commands to facilitate the editing of some of the files mentioned below.

1) Modifying Locale variables The first thing you will need to do is to update a couple of locale variables. Navigate and open the file: /etc/sysconfig/il8n You need to add the following two lines to it:

LANG=en_US.utf8 export LC_ALL=en_US.utf8

What we are doing is correcting a small spelling mismatch on the US utf8 standard value. The above instructions on the file will ensure that those variables are correctly set at boot time. However they can also be run separately on a terminal console at any time.

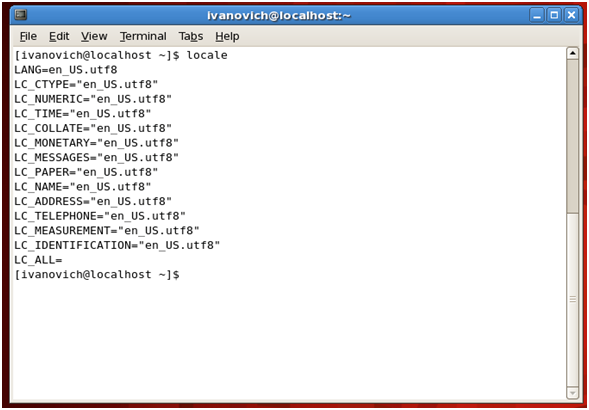
To make sure your variables are correctly set you can type “locale” on your terminal console. A listing with your available locale variables should pop up.

Modifying locale variables in Linux

2) Permissions to Source and Install folders You will need to set execution and write permissions to the folders created previously for the source install files and the folder where the Business Objects system will reside. To do that you need to run the following commands on the console as root:

chmod -R 755 /boinstall /bobj chown -R usergroup:user /bobj /boinstall

Note that I’m using the folder names suggested earlier for the folders; usergroup:user is the default non-root user that would be running the installation and a default group it belongs to.

Be very careful with the spelling of these lines. Chmod is a powerful Linux command that could render your system unusable if not used wisely.

3) Setting up Hosts file Go to /etc/hosts as root and open this file for edition. You will need to add a line to resolve your Linux system IP through the network. It should look similar to the following:

192.168.0.1    linuxsystem

There should already be a line for 127.0.0.1 which is the localhost or loopback network interface definition. Save the hosts file with the new line for your system.

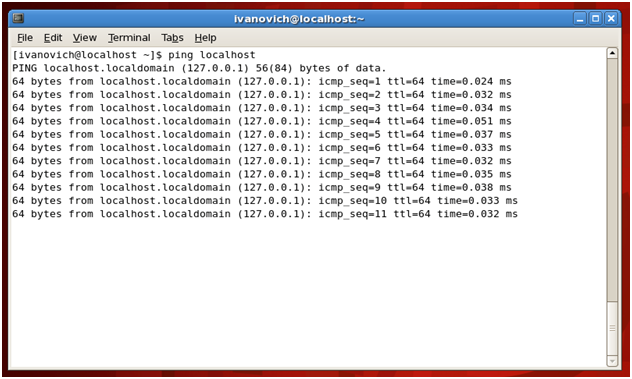
To test that your hosts files line has been correctly setup, try to execute a ping command from the console to the name of your system:

ping linuxsystem

You should receive a response if the hosts file has been set correctly.

Ping Linux system
Ping Linux system

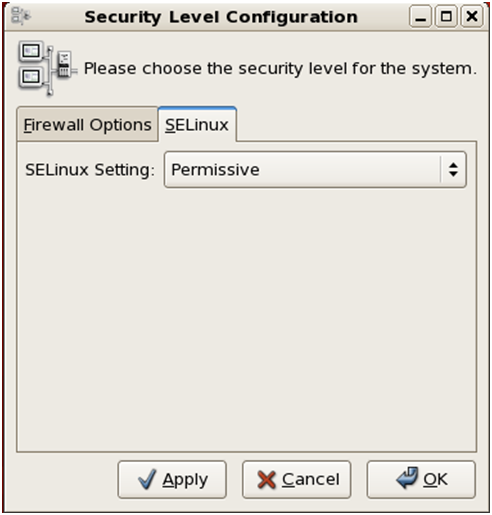
4) Disable SE Linux Still logged in as root, modify the SE Linux functionality. There are three levels for it:

  • Enforcing: The default mode which will enable and enforce the SELinux security policy on the system, denying access and logging actions
  • Permissive: In Permissive mode, SELinux is enabled but will not enforce the security policy, only warn and log actions. Permissive mode is useful for troubleshooting SELinux issues
  • Disabled: SELinux is turned off
Security Level Configuration

You will need to change it to Permissive or Disabled.

5) Adding libstdc++ libraries In some cases (CentOS) these libraries are not available by default. You can try to add them from the Linux repositories running the following command:

sudo yum install compat-libstdc++-33

This library can also be found on different places and formats on the web. If not installed, Business Objects setup will fail, indicating the missing library.

In summary...

if you have completed the steps above, you are now ready to install Business Objects on your Linux box.

We will be covering the Linux setup in the second part of this article. Stay tuned for Part 2 coming soon and please feel free to leave questions or feedback below using our Comments form.

It is a must to go through the supported documents pdf for Linux available at the SAP Marketplace. In this document you will find specific details on the versions and patch level that you need to comply with in order to install Business Objects.

It is a must to go through the supported documents pdf for Linux available at the SAP Marketplace. In this document you will find specific details on the versions and patch level that you need to comply with in order to install Business Objects.

How to Use WebIntelligence Input Controls Efficiently

Input Controls provide your WebI reports with the interactivity you need for the proper selection of information, but this functionality comes at a price. When the amount of data handled is high, performance issues may appear during developments. In order to help with this issue, we recommend the following design technique, which can be used to improve the performance of your interactive navigation.

Follow this 8-steps process to become familiar with this solution:

  1. Create a WebI document with two Queries: a) One Query containing the "cube" with the data we want to monitor together with a dimension [Link1] containing the word "LINK" and b) Another Query with two dimensions: [Input Controls List] containing a single list* of the dynamic object to use and an object (Link2) containing the word "LINK" (* A derived table containing hardcoded values can be used)
  2. Create a Merged Dimension (e.g. [LINK]) that unifies the 2 linking dimensions)
  3. Create a detail variable called ICF (Input Control Flag) with the formula [Input Control List] and use [Link1] as associated dimension
  4. Create a dimension variable called X-Axis. This will contain the dynamic object to be used in the reports. It consists of basically a big IF sentence, using the [ICF] from the 2nd query and the objects we want to use as axis from the 1st Query. See as an example: =IF([ICF]="Business Unit";[Business Unit];IF([ICF]="Customer Type";[Customer Type];...))
  5. Create components in a report (e.g. a table and a graph), containing the X-Axis and the measure we wish to show.
  6. Create the input control with the following features: a) Use the [Input Control List] dimension b) In dependencies, select the components (tables, graphs, cells, etc.) that will be affected by the input control.
  7. Create the following filter in every component to be effected: [LINK] Equal to {‘LINK’}
  8. Last but not the least, in Document properties "Extend Merged Dimension Values". This is very important for the correct functionality of the solution.

If we want to take this to the next level and have full dynamic reports we could have 2 additional input controls, e.g. one additional Y-Axis and one measure. To achieve this it would be enough to create 2 additional queries with new Input Control Lists and follow the steps 2-7 for them. In the case of the measure it is better to use sum/if clauses in step 4. Once implemented, this solution will allow easy scalability as new content can be quickly added with few modifications in the front-end interface.

If you have any questions or feedback about this solution, please feel free to leave a comment below or send an email to info@clariba.com.

Rapid Solutions for Business Intelligence with SAP Rapid Marts

As a BI consultant or an IT/IS specialist in your a company, perhaps you are looking for ways to to extract data from SAP R3, Siebel, Peoplesoft or Oracle source systems in record time.

Do you think that your knowledge of the source system database and links between tables is not deep enough to build a star schema data model?  Does the customer or internal department want the data extraction to query the data and in addition, some predefined reports on top of that information?

If you answered yes to the questions above, it is more than likely that your best solution is to implement an SAP Rapid Mart.

A Rapid Mart is a pre-built data warehouse solution based on DataServices, Relational Databases and BusinessObjects BI tools. It is best explained by looking at it from a consulting perspective. Imagine that a company wants to build a custom data warehouse solution. The consultants install DataServices to extract, transform and load the data from the FICO module of SAP R3. Then they design the reports to show to the users, check the details from the source tables (fields, joins, etc.), and design a Star Schema data model supporting these reports and also the ad-hoc query reporting.... After a few months they deliver a first version to the end-users. But as the business grows, the end-user will be asking for a new development to build a new extraction for the FICO module or maybe the SD one. With Rapid Marts, the whole solution is already there.

The steps of a Rapid Mart implementation are as follows:

  1. Run the script that generates the target data model (this builds the data warehouse as a star schema)
  2. Import the “atl” files (that builds the ETL – Extract, Transform and Loading) to Data Services
  3. Configure the ETL with the source and the target database
  4. Continue with other customization that may need to be done (this depends on each of the Rapid Marts available and data on the ERP)
  5. Import the predefined reports with the Import Wizard tool from SAP Business Objects.
  6. Set up the security for the reports (which users will have access to the predefined reports imported with the Rapid Mart solution)

With an “out of the box” ERP, you will need a maximum of five days to implement the complete solution. End-users will not only have access to some predefined reports, but also the ability to build new ones.

However, in addition to the previous steps, you may choose to consider further customization that is not included the Rapid Mart installation guides. Generally these steps are related to the integration of a company’s content with the SAP BusinessObjects platform:

  1. The company’s ERP could be customized. This could be an easy customization, such as using some ERP fields to save different types of data, or it could include a bigger development, which also needs to be added to the Rapid Mart customization. Depending on the type of customization, some additional days need to be added to the development plan. As an average (and depending on the type of the customization), Clariba estimates up to 10 days to fit the new ERP development to the Rapid Mart.
  2. If there are confidentiality concerns within the same company (in regards to the data available for ad-hoc query & analysis and the predefined reports), Row Level Security could be implemented. Depending on how easy it is to implement (this differs depending on the company’s security) it could take five to 10 days.
  3. Finally, if you want to build a dashboard on top of Rapid Marts you will likely require specific information for top management users. These users may only need to check high level KPIs and may require access to the information directly instead of having to build their own reports. Building a dashboard on top of the Rapid Mart data will ensure that top management can have all the information they need in order to make proper decisions. Clariba is experienced in building dashboards on top of Rapid Marts as we offer a packed solution that includes a Rapid Mart deployment with an operational dashboard on top of it.

In summary, by implementing SAP Rapid Marts you can look forward to the following quick wins:

  • Integrated Data Model and ETL Framework (best practice blueprint)
  • Updated universes and updated reports for all Rapid Marts (Rapid Marts versioning comes with the ERP versioning)
  • Low development and maintenance costs
  • Tested and guaranteed

If your company has decided that Rapid Marts are the rapid solution you are looking for, do not hesitate to ask Clariba for further information or to demo the Rapid Marts capabilities. If you are a consultant with additional suggestions or questions about Rapid Mart implementations, please feel free to leave a comment below.