""

SAP BusinessObjects

Xcelsius - Finding the Location of a Click

While developing an Xcelsius dashboard for a Clariba customer, I came across two interesting challenges related to the location of a click on drillable charts.

Finding the location of a click on a drillable chart – Part 1

I was working with a drillable chart with two series and I wanted to know where the user had clicked (i.e. which series and which position).

With only one series there wouldn't be any problem. Xcelsius can send the selected series to a cell, and the selected position to another cell. But with more than one series, each series can still send a position, but Xcelsius does not allow all the series to send the information to the same place. So the information has to be sent to different places. As a result, it's hard for the developer to know which point was clicked last, as the information sent before is not deleted.

Solution The idea is to use the series name in a VLOOKUP function to find out which position was sent last.

For the details, I have used the attached Xcelsius file:

As Xcelsius forces us to send the information from the different series to different places, let's do it.

In the attached file, I sent the positions to two different places (Drill!B2 for section 1, Drill!B3 for section 2). But how did I know which value was sent last? I simply used the series name. I have configured the chart to send the series name to Drill!B5, and I use a VLOOKUP function to find the relevant position (see the formula in cell Results!B4). I can then use this position to find the label (or any other relevant information) with the OFFSET function (cell Results!B1).

Finding the location of a click on two drillable charts  – Part 2

In the second scenario, I had two drillable charts with the same horizontal axes and the same series. I wanted to know where the user had clicked (i.e. which graph and which point - series and position)

With Xcelsius it is not possible to send the name of the clicked graph somewhere. Each series can send a position (or value, row or column), but Xcelsius does not allow all the series to send the information to the same place. This is the same challenge as Part 1 in that the information has to be sent to different places. As a result, the developer doesn’t know which point was clicked last, as the information sent before is not deleted.

Solution The idea is to send rows with position and graph name (instead of sending only the position), and to use the series name in a VLOOKUP function to find out which row was sent last.

For the details of the solution I have used the attached Xcelsius file:

When the user cliced on a dot in a chart, I wanted the graph to send 2 pieces of data: the graph name and the position (in the horizontal axis). Instead of sending only the value or the position, I configured the charts to send a row (columns also work). The sent row had the two pieces of data in it. In the example file I configured the quantity chart to send the data from Drill!E2:F3, and the value chart to send the data from Drill!E5:F6.

When the first series is clicked, the data is sent to Drill!B2:C2; the second series is sent to Drill!B3:C3.

So now we have the chart names in Drill!B2:B3 and the positions in Drill!C2:C3. But how do we know which row was clicked last? For this we use the series name. I configured each chart to send the series name to Drill!B5. Now, if I click in the chart Quantity, on the dot Section 2 / Month 2, then "Section 2" will be sent to Drill!B5, and Drill!E3:F3 will be sent to Drill!B3:C3.

Then I simply put the information together. I found the chart name with a VLOOKUP function on the series name (formula in cell Results!B1), the position with another VLOOKUP (cell Results!B5), and the month with an OFFSET on the position (cell Results!B2).

This has been a quick look at the ways to find the location of a click on drillable charts… I would be interested to hear if anyone else has found a solution for similar challenges. If you have any feedback or ideas, please feel free to leave a comment below.

Integrating BOXI R3 with Microsoft Sharepoint: A Practical Guide to Getting Started

In October I introduced the topic of Integration capabilities between SAP BusinessObjects and Microsoft SharePoint, highlighting the benefits of the integration for those companies that want to streamline their Business Intelligence content through their company portal. In this article I reported a comparison of the integration software that SAP offers to BO customers, based on the different system configurations, and presented the features of the leading product currently available, called Integration Option for Microsoft Sharepoint – IOMS.

In follow up to the initial investigation, one of our customers recently asked us to implement IOMS on an existing BusinessObject XI R3 Edge and Microsoft Sharepoint Server 2007 platform. Based on this customer success story, I will explain the requirements and the steps I went through in order to set up and install the IOMS software.

Choice and download of IOMS

A general note before any installation: the IOMS software obviously needs to be compatible with the current version of BusinessObjects. Several versions of IOMS are therefore available for download from http://service.sap.com according to the following schema:

  • BOXI 3.1 SP1 > Integration Option SP1

  • BOXI 3.1 FP1 > Integration Option FP2

  • BOXI 3.1 SP2 > Integration Option SP2

  • Etc…

Installing the IOMS Package

The first challenge I faced during the installation was related to the fact that Microsoft Sharepoint and Business Objects were installed on different servers. This is a common practice to maximize the performance of each systems, but how do we ensure that this configuration allows for the integration?

One important prerequisite was that the IOMS software had to be installed on the SharePoint Server, but during the first installation attempt, the following error messages appeared.

Installation Errors

The issue can be solved as follows:

If you are trying to integrate IOMS with BusinessObejects Enterprise, the .NET SDK has to be installed on the SharePoint Server before installing the integration kit. Note that in addition, the BO Enterprise Web Tier needs to reside on the same server as SharePoint, therefore it is necessary to configure the BO platform accordingly.

If you are trying to integrate IOMS with BusinessObejects Edge, despite what the error message suggests, a full installation of Edge needs to be performed on the SharePoint Server. The same license of the existing operational BusinessObjects Edge can be used. Also if there is a fix pack or service pack on the existing BusinessObjects Edge 3.1 the same should be installed on the SharePoint Server. Do not install the SDK on the SharePoint Server, as this conflicts with Edge. After the installation, all the BusinessObject Services on the SharePoint Server need to be stopped and only then the installation of IOMS can be completed. BusinessObjects Edge will remain a “silent” installation on the server.

Another crucial point we encountered during the kit installation relates to the configuration of the BusinessObjects InfoView interface, and resolves an open question from our previous blog article.

During the installation of IOMS, the administrator is asked to choose the preferred interface for viewing BusinessObjects objects inside SharePoint. Both .NET and Java are available, which confirms that IOMS is not intended to work only with BusinessObjects systems configured with IIS web servers.

Integration Option

The subsequent steps of the installation wizard allow you to specify the server name/IP and authentication settings necessary to connect to the operational BusinessObjects environment. I don’t have a specific recommendation to make about this point; just remember to check the connectivity to the BusinessObjects server (via cmd… ping BO server, or simply test InfoView with Internet Explorer).

Configuring the deployment of the Web Package

After you install the Integration option for Microsoft SharePoint software, the icons or shortcuts are not added to the Start menu. IOMS is not an application, but an add-on software that includes a package of BusinessObjects-specific web parts that are added to the SharePoint deployment.

As a result, eight new BusinessObjects web parts can be selected at any time from the Home Gallery folder in SharePoint:

  • Content Explorer Web Part

  • User Actions Web Part

  • Advanced Search Web Part

  • Dashboard Web Part

  • Document Viewer Web Part

  • Xcelsius Viewer Web Part

  • Crystal Report Viewer Web Part

  • Analytical Report Viewer Web Part

The most important of them is the Content Explorer Web Part. This is the reproduction of Infoview within SharePoint and is mandatory to work with the BusinessOjects content, as it includes the logon window to the operational BO system. Any other Web Part needs to be used in combination with the Content Explorer.

BusinessObjects

And here is a picture of how the final BusinessObjects-Sharepoint deployment  in use would look like:

BusinessObjects Integration in SharePoint

After installing the Integration option for Microsoft SharePoint software, the administrator can finally configure additional options that are specific to each deployment. It is also worth mentioning the SSO authentication with AD credentials, allowing you to navigate BusinessObjects within SharePoint without repeating logon credentials at the moment of use.

The details of this configuration are reported in the IOMS Administrator Guide, but based on our experience this is often a tricky configuration that involves the modification of .NET system files. Stay tuned for a complete troubleshooting guide on SSO configuration to be published in future blog articles.

In October I introduced the topic of Integration capabilities between SAP BusinessObjects and Microsoft SharePoint

Loading Message Solution for Xcelsius

One of the most challenging issues that Xcelsius developers face everyday is related to the performance of dashboards. Sometimes performance can be improved by changing the connection properties, changing the queries, reducing the Xcelsius components or reducing the formulas within the Excel sheet that populates the dashboard.

However even after making these adjustments, it’s possible that the dashboard may still take longer than expected to load. In fact, the calculation of some critical formulas such as SUMIF or VLOOKUP can take several seconds to update the values. But rather than explaining to users that the dashboard is locally calculating the values and that they simply have to wait for a short while, why not show them the loading progress in action…

What I have created is an “enable” button for our filters that will show the loading message for a defined period of time before showing the data. Please note that this is meant for Excel triggering and not for queries (even if it can be easily adapted by using some of the outputs as triggers for the data connections).

The components I used are as follows:

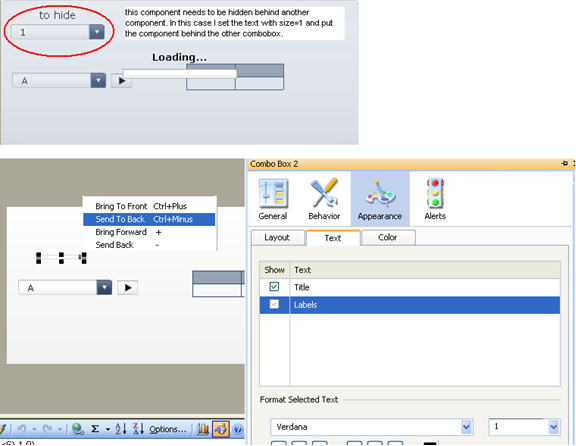
  • Combobox 1: This is filtering only the labels and sending the selected one to a destination (using filtered rows settings).
  • Combobox 2 (behind 1): This filters the entire table only when the play button sends values greater than 0 (so it is in PLAY mode) and less than our max time (in this case 6 seconds). It uses filtered rows and sends the output to a destination. Note: it filters the value 1 from the column with a formula that says: IF what I selected from combobox 1 is equal to what I see in the related column of my source table, then 1 else 0.
  • Spreadsheet Table: I needed an output control to show the values, but of course in real life this could be any other component.
  • Play control: This manages both our loading message and the combobox 2. It has the auto rewind option enabled but neither the auto play nor the auto replay. We should calculate the time that we need to show our loading message and set the play control to that value (or that value +1. it depends on the logic you want to use).
  • Background: This is meant to create the real loading effect that thanks to the “Block mouse events” option avoids any inappropriate clicks of our users while the dashboard is thinking.
  • Text label: This says “Loading…” but could say something else. The important thing is that the user needs to understand that the dashboard is calculating the values.
  • Horizontal progress bar: I used this control that shows the output values of the play button to have more loading effect.

Note: the last three components have been chosen within the out of the box ones to keep things simple. In a real case I would use some flash animations or the loading component that has been released by Donald MacCormick within the xcomponents solution.

The formula I used to show the loading message (and enable combobox 2 as already explained) says the following: IF the output value of the play control is greater then 0 and less than the maximum I need, then 1 else 0.

I hope you find this solution helpful and easy to implement. Feel free to check out the SWF file to see an example of how the loading message solution works and download the test XLF in the zip file below. Let me know if you have any questions or comments.

SWF file: loading message_solution

XLF file: test_v3

SAP BusinessObjects Dashboards running on Android

While Apple and Blackberry users struggle to find ways to visualize the latest versions of flash content with their devices through several applications and plug-ins, Google with its open source philosophy, seems to be in first position in this race.

The latest release of Android, v2.2 (“Froyo”) based on Linux Kernel 2.6.32, natively supports the Adobe flash technology used by SAP BusinessObjects Dashboards (formerly Xcelsius) and SAP BusinessObjects Explorer. The difference is that it allows for the interactive visualization of Dashboards, WebIntelligence reports and exploration spaces without the need for a third-party application, unlike iPhone, iPad and Blackberry.

This means that your company can leverage the effort spent building Xcelsius dashboards by providing mobile employees with a very powerful and interactive interface to make business decisions in the field. It is clear that not all dashboards would be suitable for mobiles and screen dimensions should be taken into account when developing, however below you will see an example which was not specifically designed for mobile but actually fits perfectly in my HTC Legend.

Dashboards on Android

Adobe announced officially on October 25, 2010 that Google's Android OS 2.2 already includes the Flash Player 10.1 plug-in as well as the brand new HP Palm Pre 2, but did not say yet when it will release the versions for the BlackBerry OS, Microsoft's Windows Phone, the Symbian OS, or Nokia/Intel's MeeGo.

Apple has insisted that iOS-based devices like the iPhone and iPod touch will never offer a Flash player. Instead, the company is looking in another direction, surprisingly towards an open standard this time: HTML5.

Finally, on the BI vendor side, it is also interesting to note that as a result of an increasing demand for BI content in Apple devices, SAP BusinessObjects, which used to endorse an application called Roambi Mobile Dashboards by MeLLmo, Inc., is currently developing its own solution for an interactive BI experience which we will certainly have to keep an eye on.

If you have any comments about developing dashboards for mobile devices, feel free to leave a note below.

A Quick Integration of Personal Data with your SAP BusinessObjects Platform

Dealing with personal files has become a harder task with the latest integrated platforms. Higher centralized security together with the presence of web-based tools has reduced the amount of control that users have over the information.

In order to give some power back to users, SAP BusinessObjects has provided rich client tools that enable users to access some of their personal files. However this feature is limited to excel and text formats and causes the corporation to lose control of the files inventory because users are then able to store files in their own machine.

For those companies who wish to have a tight administrative control on their content but at the same time provide quick access to personal files such as text, Excel or even through free hand SQL’s (FHS) , the concept of Universes on top of personal data might be a good solution.

Universes on top of Excel, Text or Free Hand SQL

The concept is simple: the idea is to demand from users which data they want to monitor in their systems and give it back to them in Universe format. They may then use it in their reports as if it was corporate information, either through merging dimensions in WebI or building Queries as a Web Service to populate front-end modules such as WebI itself or Xcelsius.

Universes on top of Excel or Text files will typically have the following features:

  • ODBC generic connections using the Microsoft Excel or Text native drivers
  • Every text file or every Excel tab will appear as a Universe table
  • Tables in Designer do not generally have joins, that is to say, tables show like isolated “islands”
  • A Universe class is typically corresponding with an isolated table and it can be secured so it can be seen for the user only

In the case of FHS, if personalized SQL sentences are needed, we will act similarly but with the following differentiations:

  • The Universe connection is the native connection of the data source
  • Every table in the Universe is a derived table containing the query

Text files Roadmap

Read and apply the following guidelines to use text files as personal data sources:

  • Place all the text files in a common folder
  • Define a Microsoft text driver pointing to that folder
  • The folder acts as a database
  • Text files act as tables
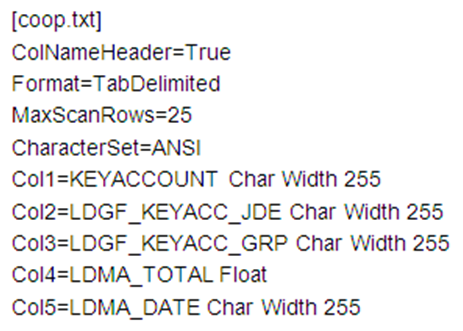
  • The key here is to define well the schema.ini file. Normally the assistant fails to create it so it needs to be adjusted manually (see sample below)
  • Create an empty universe using an ODBC generic connection pointing to the driver, add the text files as tables, link them if necessary, create objects and export (use aliases if format brings Errors)
  • Export the universe

Fig1. A sample of a schema.ini file

Excel files Roadmap

Read and apply the following guidelines to use Excel files as personal data sources:

  • Place all the Excel files in a common folder
  • Define a Microsoft excel driver pointing one of the files in the folder
  • The folder acts as the database instance
  • The Excel files act as the databases
  • The Excel tab files act as the tables
  • Create an empty universe with a Microsoft Excel connection pointing to the driver. Keep in mind that there is no alternative as an ODBC generic connection will not work!!
  • Add the tables, link them if necessary, create Objects and export (use aliases if format brings Errors)
  • Export the universe

A very good feature we can take advantage of is that a driver pointing to one file will be enough to retrieve all Excel files in that folder.

Free Hand SQL Roadmap

Read and apply the following guidelines to use personalized SQL calls as personal data source:

  • Define a native driver pointing to the desired database
  • Create an empty universe with a proper connection pointing to the desired database
  • Create derived tables without linking. The content of them will be the [SELECT XX FROM XX WHERE…] sentences that we want to pull from the database. Use AS command if we want to give a different name to the field
  • Create Objects
  • Export the universe

Conclusions

With these pieces of advice a system to access personal information can be built into your corporation’s BI system. With a minimum of three universes we can query these three types of files. A drawback is that for Excel or text formats only single access is possible, so only one user at a time can access that information. This can be bypassed configuring universe security accordingly so one class can only be seen by one user.

This method provides quick visibility on personal data which is ideal for actions that require a single access like building prototypes & demos or for sequential scheduling and distribution of reports.

If you have any questions or comments about this concept, please feel free to get in touch.

Tips for Installing Xcelsius 2008 with Office 2010

While Microsoft Office 2010 has been available for retail since June 2010, the latest version of Xcelsius (2008 SP3 FP3.3) is not yet officially supported. At the moment you are supposed to run it with Office 2003, XP or 2007. But you may be interested to know what happens if you try to install Xcelsius 2008 on a computer which "only" has Office 2010…

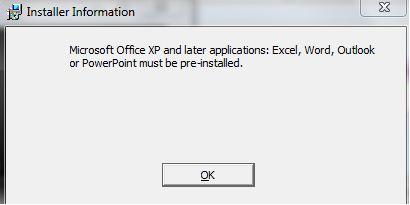
To begin with, you get the following message:

Microsoft Installer Information

In reality, Xcelsius 2008 will work fine with Office 2010. The only question is, how do you get rid of this installation problem? A possible workaround is to install an earlier version of Excel, install Xcelsius, then remove the older Excel. But it takes time, and you probably don’t have any installer file for an earlier version of Office.

The purpose of this post is therefore to allow to you to perform the installation of Xcelsius 2008 with Office 2010 in a quick and efficient way. The principle of the workaround is to prevent the installer from checking the presence of Office on the computer by tweaking it.

Prerequisites:

  • An Xcelsius installer file. For this article I’ve downloaded the file xcelsiusent2008sp3.exe from SAP Business Objects Software Downloads.
  • A license key available on service.sap.com/support – Keys & Requests
  • InstEd, a free MSI editor
  • A software able to extract data from zip-formatted files. 7zip works fine and is free – also for commercial use.

Steps:

Extract to Xcelsius
Extract to Xcelsius
  1. The Xcelsius installer file is a zip archive. Extract the data from it.
  2. Download the latest version of InstEd and install it on your computer.
  3. Make a backup of the "Xcelsius.msi" file located in the "package" folder. If you make any mistake with the msi file you'll be able to recover it.
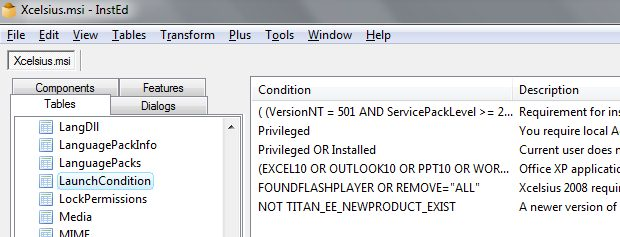
  4. Open with InstEd the" Xcelsius.msi" file. On the left part of the screen, in the "Tables" tab, click on "LaunchCondition". On the right side you’ll see a list of conditions that are checked.
  5. Delete the row which refers to Office (it begins with "(EXCELl10 OR OUTLOOK10") and save the file.
  6. Now execute the "Xcelsius.msi" file you’ve just modified. You shouldn't have any error message regarding Office anymore. Accept the license agreement (although it may not be displayed), enter your name/organization/keycode (license key) and choose the options you need. After copying some files, the program will tell you it's finished installing Xcelsius.
  7. You may meet another problem during the first run of the program: although you entered a valid keycode, Xcelsius considers it as expired. Entering the keycode again won't solve the problem. The trick is to execute Xcelsius as an administrator (display the option by right-clicking on the program icon).

Now entering the keycode will result in the opening of Xcelsius.

Note: the tests were done on Windows 7. If you meet with other behaviors on different platforms, please let me know!

Active Directory SSO checklist for SAP BusinessObjects

Let’s face it, an SSO implementation is not an easy task. Even though the steps are clear to us as BI consultants, there is always the chance that something is missing or that we need to apply changes to configurations due to differences between the real environment and the manual. It is also very common not to detect such differences, as there are multiple types of environments and multiple configurations that may differ from the guides.

The purpose of this post is not to provide another guide for AD+SSO implementation, but rather to offer a checklist that you can go through when the implementation is not successful and the SSO with AD is not working as desired. This list can also be helpful when performing the task, as it is highly recommended to test all the steps during the procedure.

Steps 1 to 4 are common validations which will allow you  to fix errors that can be difficult to detect. They are related to the Active Directory Server tasks and likely need to be double checked as they are usually performed by other people (i.e. the AD maintenance team). Best practice suggests that you should plan to check every single task,  especially the ones that are not performed by you or your team.

  1. Test the service account for Kerberos delegation -> verify that the password of the account is set to “Password never expires”.
  2. Encryption to use for the account -> RC4 is used when DES is not selected. For SAP BusinessObjects implementations that are under XI 3.x, RC4 is preferred since it comes with the JDK 1.5 version. On earlier versions (i.e XIR2 with java SDK 1.4.2), RC4 may not work without updating the JDK to 1.5.
  3. Verify the creation of the default SPN -> run a “setspn –l” on the service account and check the output. Setspn –l should be something like this:
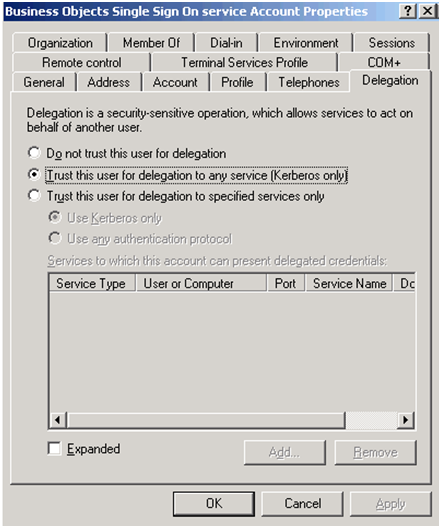
  4. Verify the delegation is enabled on the vintela SSO account -> Look for a checkbox “Trust this user for delegation to any service (Kerberos only)”.
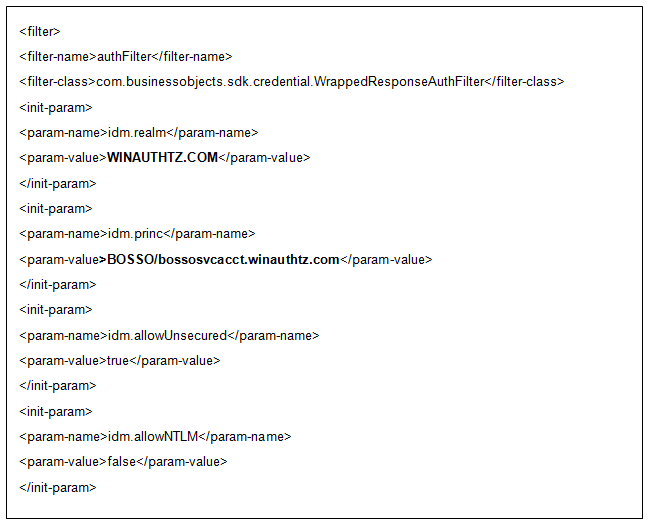
  5. In the BusinessObjects server, double check files web.xml and server.xml -> Review lines added or modified and, if possible, redo it maintaining a copy of the original ones.  Some of the validations are: a)Server.xml -> Increase the default HTTP Header. Normally it is set to 16384 but if your AD contains users that are members of a lot of groups (50 or more), you may need to increase the.  b)Web.xml -> Change the authentication default to secWinAD when using SSO. Then remember that siteminder must be set to false and vintela to true.  Remove the comments from the auth filter. After that, set the idm.realm to your default REALM (must be in capital letters). And also set your idm.princ to the default SPN. These three last steps, are shown as follows:
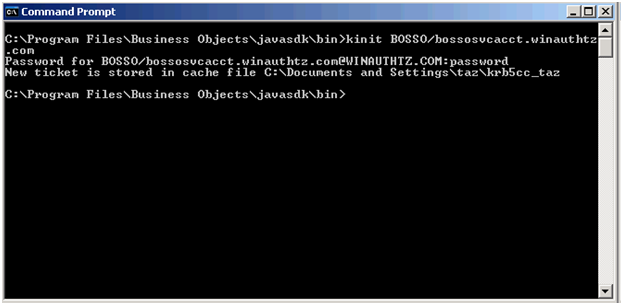
  6. Verify vintela filter has been successfully loaded  -> to do that, remove all logs in the Tomcat folder after stopping the service and restarting it again. Then search in the stdout file for the credentials obtained. If the credentials are obtained, the vintela filter is being loaded successfully. If the credentials are not obtained, you may run the kinit and check the output as the following image shows:

If you have solved your problems by following the points in this post, congratulations! If not, don’t give up, keep on searching in different forums, trace tomcat (there are several configurations you can add on the console), scan packets from the clients related to SSO issues, or ask us for guidance. In the worst case scenario you may need to redo the implementation from scratch. Whatever the case may be, we’re sure that in the end you will succeed!

SAP BusinessObjects and Microsoft SharePoint Integration Capabilities

Nowadays many companies are making a considerable effort to guarantee the constant sharing of information, knowledge and expertise across their organizations. It comes as no surprise that Information Technology plays a key role in responding to this challenge.

A very popular IT solution for organizing enterprise information is the use of company portals. From an IT professional perspective, portals combine enterprise data and applications that reside on the company intranet into a tight infrastructure. From a business perspective, portals provide users with easy access to data and applications through personalized views.

Business Intelligence is also an important part of this discussion for companies that want to use their intranet portal to deliver reports and dashboards to end users. For example, one of our customers has recently asked us to investigate the integration capabilities of Business Objects XI R3 with the leading portal-solution on the market, Microsoft SharePoint.

In this post I will introduce the topic of integration capabilities and benefits. Due to its complexity, this topic also promises to be an interesting focus for future blog articles and continuous technical investigation.

Why Integrate BusinessObjects with SharePoint?

Integrating BusinessObjects with SharePoint allows users to view and manage information within a Single Portal Interface. This integration grants access to all business intelligence resources such as interactive Xcelsius Dashboards, Crystal Reports, Web Intelligence, and any Microsoft Office documents that are stored in the CMS Repository. Therefore, users can navigate BusinessObjects personal/favorites folders, public folders, inbox, as well as personal categories and corporate categories within SharePoint.

The clear advantages for business users are:

  • A unique and easy point of access to any kind of BI content (but not exclusively  BI), compared to InfoView, which is a powerful tool but still represents an additional and restricted interface.
  • A simplified and more efficient use of software licenses, eliminating redundant licenses for those users that are typically viewers of BI content with no need to edit reports. In this case SharePoint allows them to view and refresh Crystal or WebI reports from within the portal.

From a System Administrator point of view, integration with SharePoint offers the possibility of reducing duplication in the backend infrastructure and consolidating BI tools with other technologies in one enterprise portal with a single security model.

While the benefits of such an implementation are clear, I found that there is still some uncertainty surrounding the available options for deployment. Taking into account new and old releases, several different versions of BusinessObjects and SharePoint are being used within organizations today. In the past few years SAP has released multiple versions of the “SharePoint Portal Integration Kit” for BusinessObjects, and both XI R2 and XI R3 can be matched with SharePoint 2003 or 2007.

Both BusinessObjects Enterprise and Edge customers are entitled to download the integration kit from the SAP developers’ portal. Moreover, although it’s not specifically advertised by SAP, there is evidence of successful implementations of BusinessObjects XI 3.1 with Java InfoView interfaces on www.forumtopics.com/busobj. This suggests that even companies that are not using a .NET interface will be able to exploit the integration capabilities of BusinessObjects with the portal.

However, a .NET interface seems to be the ideal condition for achieving full integration with the Microsoft platform. In fact, the integration kits for Microsoft SharePoint 2007 and Microsoft SharePoint 2003 have gained acceptance in the marketplace but have limited capabilities. As a result, SAP recently released an additional product, with the intention of providing all of the .NET InfoView capabilities from within the SharePoint interface. The product has been released with the name of "Integration Option for Microsoft SharePoint software 1.0".

The following table, from an official SAP source, clearly shows how superior this option is compared to the previous integration kits:

Further information on the available SharePoint integration kits can be found on www.sdn.sap.com. Integrations kits are free of charge and all direct zip file downloads are available here.

On a final note, it is worth speculating on what is to come in the near future. Regrettably, the current versions of the PIK and the IOMS do not provide an option for integration with SharePoint 2007 64bit. All existing products integrate with 32bit versions of SharePoint. But not to worry; with the recent launch of SharePoint 2010, available in 64bit mode only, SAP is catching up with an ad hoc version of the PIK. According to rumors on the SAP developers’ forums, the 64bit integration kit will be released by mid 2011, following the launch of BusinessObjects XI R4 later this year.

Will this be the chance to improve the integration capabilities with Java InfoView interfaces… We can’t say just yet. But stay tuned for updates on this topic and for more technical insights in future blog articles.

Doing BI Right: Why you need a proper business intelligence methodology

We have often faced situations where people thought that the mere fact of having a Business Intelligence tool and qualified consultants were enough to guarantee a successful BI implementation. However without a good BI methodology it can be difficult to meet deadlines, satisfy all the users and stay within budget, even with the best of intentions.

In this post I will briefly talk about some aspects of a methodology that we have implemented with some of our customers.

Distinction between power and normal business users

Accuracy of the reports is key to people who want to ensure that they are making the right decisions. Therefore it is important to always have a group of power users who can work on difficult reports and are able to understand how the data is modeled. These people usually work on predefined reports as well as difficult ad-hoc analysis.

Normal business users usually work on personal and ad-hoc reporting. They want to get their questions answered very quickly, but for that they need to have very good and simple universes. For example, most of these types of users are not comfortable working with universes that have contexts.

Implementation of a good business gathering scenario

From our experience, gathering business requirements properly leads to the correct delivery of complex analysis to the business.  We have had the best results when the requirements gathering process has been:

  • centralized: the business should always think of a single point of access for business requirements gathering. If this is not centralized, the process can be hard to define.
  • recurring: it should also recur regularly as a proper business gathering process is never finished. We have usually set recurring meetings (weekly, twice per week) where some people from the reporting team meet their business sponsors and agree on the next actions to take.

Implementation of a good lifecycle and version control tool

When working with large enterprise customers (with many developers) it is always good practice to implement a version control tool as well as a workflow in order to promote content from development environments to production.

With version control tools the developers can share, lock and control their versions so everything is kept under control. This is especially important in large environments.

It is also important to have a criteria list of points that the reports should meet before they are promoted to production. This way, we make sure that whatever is in production has been properly tested and confirmed (the criteria can refer to query performance, layout format, etc.)

There are many third party applications that offer the version control as well as the lifecycle management functionalities.

Distinction between personal and public areas

BusinessObjects already makes the distinction between personal and public folders.  This point goes together with the previous point. We have always implemented the lifecycle processes under the public area so this basically becomes a read only area in production.

By doing this we achieve the following:

  • Users can be confident about all that is under the public folders as that content meet the proper criteria before it has been promoted to production
  • Public folders are cleaned
  • Public folders are tidy

If you are about to undertake a new BI project, especially one in a large customer environment, I hope the tips above will be useful to your team as you build your own best practice BI methodology. If you have any ideas to add or any feedback about my suggestions, please feel free to leave a comment below.

SAP Social Network Analyzer: Old Concept, New Horizons

A social network is a structure composed by interconnected elements. From a network theory point of view, the so-called “nodes” can be individuals or organizations and are connected to each other interdependently by various types of relationships.

The concept of a social network is not a new idea. In fact, the term has been used for over a century, although complex relationships between members of social systems have been out there from the very beginning of human existence. However, social network analysis is an area that is constantly evolving and has become a key technique in modern sociology. Other professional sectors are also interested in following the trends, such as marketing, information technology, communication, economics, geography, sociolinguistics, anthropology, biology, etc.

There are some factors that are definitely fueling this interest: the proliferation of social networks on the Internet (with a constantly increasing penetration rate) and the evolution of mobile devices (smart phones) that integrate most of these social networks in a single point of access.

The fact that more and more people are entering and storing data on the Internet makes it an incredibly good source for profiling, niche marketing, customer outreach, etc. Many companies have already started producing revenue thanks to their social networking efforts over the past few years.

There are many social network analysis tools in the market, but this article is based on the approach by SAP BusinessObjects. Social Network Analyzer (SNA), which started as an SAP internal tool, aggregates existing enterprise data to display and discover organizational relationships.

It automatically generates useful social networks that can be used to:

  • find and connect people
  • take actions based on individual/organization/company information
  • send an email, meeting request or call a person
  • build the right team
  • better manage and control processes
  • understand the relationships between suppliers and buyers
  • analyze people’s information and organization using BI tools
  • integrate social network information inside any application...

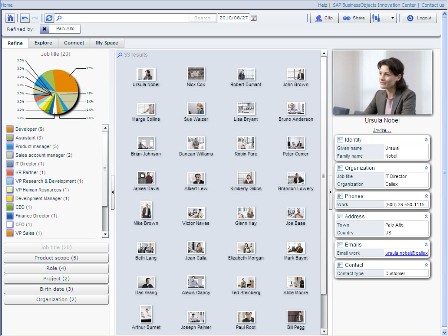
The tool allows users to get a deeper understanding of the contacts by using different features and filters. For example, the Refine tab allows you to filter your results by location, role, project, company, etc.

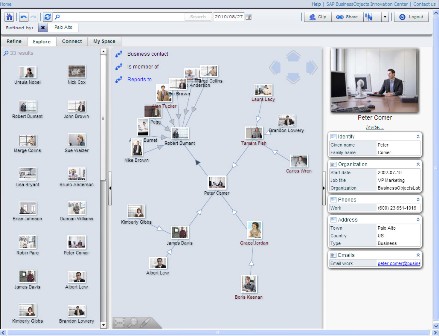
The Explore tab helps you to understand the relationships and connections to other individuals or groups, such as business contacts, teams and reporting hierarchy.

SNA is an interesting way to look at networks within or across organizations. An on-line demo allows you to test the product and see how intuitive and navigable it is. Follow this SAP URL to learn more: http://sna-demo.ondemand.com/SNA.jsp. It’s time to get social!