One of the most challenging issues that Xcelsius developers face everyday is related to the performance of dashboards. Sometimes performance can be improved by changing the connection properties, changing the queries, reducing the Xcelsius components or reducing the formulas within the Excel sheet that populates the dashboard.
However even after making these adjustments, it’s possible that the dashboard may still take longer than expected to load. In fact, the calculation of some critical formulas such as SUMIF or VLOOKUP can take several seconds to update the values. But rather than explaining to users that the dashboard is locally calculating the values and that they simply have to wait for a short while, why not show them the loading progress in action…
What I have created is an “enable” button for our filters that will show the loading message for a defined period of time before showing the data. Please note that this is meant for Excel triggering and not for queries (even if it can be easily adapted by using some of the outputs as triggers for the data connections).
The components I used are as follows:
- Combobox 1: This is filtering only the labels and sending the selected one to a destination (using filtered rows settings).
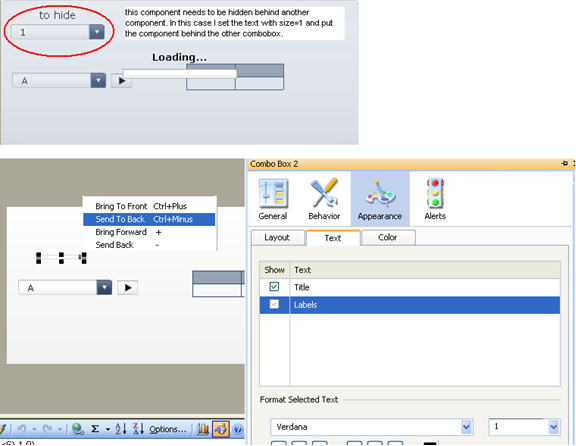
- Combobox 2 (behind 1): This filters the entire table only when the play button sends values greater than 0 (so it is in PLAY mode) and less than our max time (in this case 6 seconds). It uses filtered rows and sends the output to a destination. Note: it filters the value 1 from the column with a formula that says: IF what I selected from combobox 1 is equal to what I see in the related column of my source table, then 1 else 0.
- Spreadsheet Table: I needed an output control to show the values, but of course in real life this could be any other component.
- Play control: This manages both our loading message and the combobox 2. It has the auto rewind option enabled but neither the auto play nor the auto replay. We should calculate the time that we need to show our loading message and set the play control to that value (or that value +1. it depends on the logic you want to use).
- Background: This is meant to create the real loading effect that thanks to the “Block mouse events” option avoids any inappropriate clicks of our users while the dashboard is thinking.
- Text label: This says “Loading…” but could say something else. The important thing is that the user needs to understand that the dashboard is calculating the values.
- Horizontal progress bar: I used this control that shows the output values of the play button to have more loading effect.
Note: the last three components have been chosen within the out of the box ones to keep things simple. In a real case I would use some flash animations or the loading component that has been released by Donald MacCormick within the xcomponents solution.
The formula I used to show the loading message (and enable combobox 2 as already explained) says the following: IF the output value of the play control is greater then 0 and less than the maximum I need, then 1 else 0.
I hope you find this solution helpful and easy to implement. Feel free to check out the SWF file to see an example of how the loading message solution works and download the test XLF in the zip file below. Let me know if you have any questions or comments.
SWF file: loading message_solution
XLF file: test_v3

