Sections are traditional features in the SAP BusinessObjects Query & Analysis (QA) tools. They provide a list of items and their associated partial report, including table(s), graph(s) or both. This is very powerful, as you may imagine. As an example, a mobile phone bill is created from sections by subscriber, associating every subscriber with his/her own bill.
This blog article will describe a particular requirement together with a challenge that we faced in a real scenario and how it was resolved.
The initial requirement
In this scenario we were working with a telco company that had a systems containing its billing data. From this the requirement was to develop a table with every subscriber’s call details, as well as a graph with the last 12 months total consumption. Moreover, there were three other conditions:
- The subscribers are often grouped by company, so the total bill by company must be generated – same report –
- The resulting pdf must show Company / Subscribers, in this order, and allow users to navigate across the pdf
- At the request of the customer, the report must be done in the traditional Desktop Intelligence tool
The challenge
Starting a mockup with WebI, we built the query, dragged & dropped 2 sections (1 by company, 1 by subscriber), drafted the table and the graph, adjusted the width of sections manually so each one fell into one sheet, refreshed, exported to pdf and “voilà”, the draft seemed to accomplish our specifications.
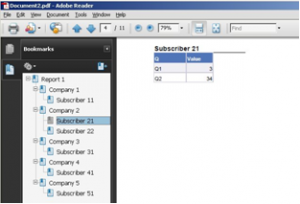
Pdf document saved from WebI with navigation to sections and subsections (each one in a different page)
When we tried with DeskI, we followed the same steps; setting the “start on a new page” and the “avoid break page in block” to active, but we still ran into the issue of a blank page. This was due to the fact that between the section and the first item of the second subsection, the "start on a new page" was not applied automatically, so we had to create it ourselves. As our bill layout was quite large (and took up the whole A4 page), the report ran onto the following page (that is to say, the end of the section), so an empty page was generated just after.
In DeskI the distance between the section and the 1st item of the 2nd subsection needs to be adjusted manually
Our solution:
The solution in DeskI was based on incremental actions. We have highlighted the advantages(+) and disadvantages (-) to give more insight into our situation:
1. Remove the “Start on a new page” option for the subsection (+) The blank page disappears (-) 1st sub-item navigation issue: The 2 lines from section / subsection appear in different pages, so PDF links do not work properly, as the button from 1st item in subsection stays in section page
2. Add a cell at the end of the first section table and graph (+) The 2 lines from section /subsection always appear in the same page, so PDF links work properly (-) In the specific case that a company does not have a subscriber, there is an empty page between companies, as 1st section ends up in the next page
3. Hide the auxiliary cell in cases when a company does not have a subscriber (+) Create a condition based on a count of subscribers inside the company, and hide the cells if that count is zero (-) None Conclusion
What we learned from this scenario is that traditional tools like Desktop Intelligence really do provide great flexibility but you have to have experts on hand who constantly push them to the limit. On the other hand, when possible we should tap into the power of Web Intelligence, which combines the Query & Analysis strength of its predecessor together with a functional capability tailored to the current web based world needs.
Feedback and questions are always welcome. If you have similar challenges, we would be happy to share our insight.


